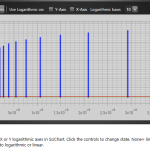
I have an issue with LogarithmicNumericAxis and FastColumnRenderableSeries. If replace one of FastLineRenderableSeries with FastColumnRenderableSeries in Logarithmic Y-axis SciChart example you’ll receive empty chart (the same behaviour in my application). Only if disable logarithmic on both x and y axis the columns (and lines) appears. How to make LogarithmicNumericAxis with columns work?
Thanks!
- Yury Tolstoguzov asked 9 years ago
- You must login to post comments
Hi Yury,
The reason you’ve seen empty chart is next: FastColumnRenderableSeries has property ZeroLineY, and it is 0 by default. When we try render the series, LogarithmicDoubleCoordinateCalculator try to get logarithm of 0, which is actually NaN, and therefore range for rendering is invalid.
Please try to set ZeroLineY different from 0. For example :
<s:FastColumnRenderableSeries ZeroLineY="1" FillBrush="#1964FF" SeriesColor="Blue"/>
Hope this helps.
Best regards,
Nazar.
- Nazar Rudnyk answered 9 years ago
- You must login to post comments
Hi Nazar
Thank you for your reply. But if I replcace a FastLineRenderableSeries in the Logarithmic Y-Axis example with your example string (FastColumnRenderableSeries ZeroLineY=”1″…) I still get the empty chart.
- Yury Tolstoguzov answered 9 years ago
- last edited 9 years ago
 Hi Yury, It's also because of logarithm properties. In this particular example case, x values are really small, like 0.0001 etc, and when we try to draw column, we need to subtract half of the column width to get the left x value, and it's lower than 0, and therefore it's logarithm is NaN. Hope it helps. Best regards, Nazar
- You must login to post comments
Please login first to submit.


