Hi there
I’m using Column Chart with LogarithmicNumericAxis for the Y axis. I noticed a crazy thing that the baseline in my chart is set to 1*E-5 by default and not modifiable.
Is there any way to change this baseline?
- Muhammad Vakili asked 2 years ago
- last active 2 years ago
I think this question has come up before, but is it possible to render a logarithmic axis in the JS library? If not, is this on the roadmap (and when)?
- Paul Crouch asked 3 years ago
- last active 3 years ago
Hi,
Using a tooltip with a LineSeries with an Logarithmic Y-axis, seem to give widely inaccurate results.
The series is as follows:
double[] x = new double[] { 1, 1.0e1 , 1.0e2 };
double[] y = new double[] { 615.9, 275.6197, 11.05376};
Using a CursorModifier as follows:
<s:CursorModifier ShowAxisLabels="True" UseInterpolation="True" SnappingMode="CrosshairToSeries" ShowTooltip="True"/>
The expected behaviour would be for the Crosshair to follow the curve, but for some reason it’s some way off. It looks as if it’s following Y-values which are somewhat truncated. X-values are fine for some reason.
Is there are a way to increase the resolution of the Y-values so the user gets the correct value when using a tooltip.
- Patrik Adolfsson asked 3 years ago
- last active 3 years ago
If you change the logarithmic Y axis to a regular NumericalAxis, the mountain series displays properly (with fill color).
- Mike Liu asked 6 years ago
- last active 6 years ago
I’m seeing the following exception:
E/Exception: null
    java.lang.ArrayIndexOutOfBoundsException: length=0; index=-1
        at com.scichart.core.model.DoubleValues.get(SourceFile:167)
        at com.scichart.charting.numerics.tickProviders.LogarithmicNumericTickProvider.updateTicks(SourceFile:94)
        at com.scichart.charting.numerics.tickProviders.TickProvider.update(SourceFile:59)
        at com.scichart.charting.numerics.tickProviders.DeltaTickProvider.update(SourceFile:81)
        at com.scichart.charting.visuals.axes.AxisBase.onUpdateMeasure(SourceFile:957)
        at com.scichart.charting.visuals.axes.AxisBase.updateAxisMeasurements(SourceFile:936)
        at com.scichart.charting.layoutManagers.RightAlignmentOuterAxisLayoutStrategy.measureAxes(SourceFile:39)
        at com.scichart.charting.layoutManagers.DefaultLayoutManager.onLayoutChart(SourceFile:235)
        at com.scichart.charting.visuals.rendering.RenderSurfaceRenderer.a(SourceFile:207)
        at com.scichart.charting.visuals.rendering.RenderSurfaceRenderer.a(SourceFile:132)
        at com.scichart.charting.visuals.rendering.RenderSurfaceRenderer.onDraw(SourceFile:123)
        at com.scichart.drawing.opengl.RenderSurfaceGL$a.onDraw(SourceFile:234)
        at com.scichart.drawing.opengl.MyGLRenderer.b(SourceFile:299)
        at com.scichart.drawing.opengl.MyGLRenderer.onDrawFrame(SourceFile:283)
        at android.opengl.GLSurfaceView$GLThread.guardedRun(GLSurfaceView.java:1571)
        at android.opengl.GLSurfaceView$GLThread.run(GLSurfaceView.java:1270)
I’m initializing my chart as follows:
SciChartBuilder.init(context)
builder = SciChartBuilder.instance()

...

val xAxis = builder.newCategoryDateAxis()
                            .withGrowBy(0.0, 0.05)
                            .withAxisAlignment(AxisAlignment.Bottom)
                            .withVisibleRange(sharedXRange)
                            .withDrawMinorGridLines(true)
                            .withDrawMajorGridLines(true)
                            .build()
val yAxis = builder.newLogarithmicNumericAxis()
                            .withTextFormatting("#.#E+0")
                            .withScientificNotation(ScientificNotation.LogarithmicBase)
                            .withLogarithmicBase(2.0)
                            .build()
val seriesData = builder.newXyDataSeries(Date::class.java, Double::class.javaObjectType)
                            .withSeriesName("Series A")
                            .build()
seriesData.append(data.dateData, data.yData)
series = builder.newLineSeries()
                            .withDataSeries(seriesData)
                            .build()

UpdateSuspender.using(surface) {
                Collections.addAll(surface.xAxes, xAxis)
                Collections.addAll(surface.yAxes, yAxis)
                Collections.addAll(surface.renderableSeries, series)
}
data object has about 300 valid data points.
Any ideas what’s going on? I tried running this on a new activity. If I swap LogarithmicNumericAxis for a NumericAxis, everything works fine. I looked at the decompiled .class file where the crash was occurring (I don’t have the source for SciChart), and it seems like the crash occurs when major ticks fail to get generated (majorTicks.size == 0). I tried disabling all minor/major ticks but no joy.
for(int var22 = majorTicks.size(); var22 >= 0; --var22) {
            double var23 = var4.fromExponent(var11);
            double var25 = var22 < majorTicks.size() ? majorTicks.get(var22) : majorTicks.get(var22 - 1) * var23;
- Mike Liu asked 6 years ago
- last active 6 years ago
Hello
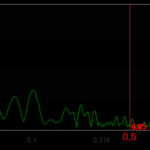
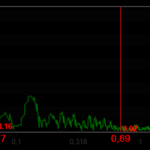
Do heatmap dataseries support logarithmic axes? i have a heatmap chart and a line (pic 1), which need to be drawn in logarithmic scale, but i get no heatmap chart and the line is drawn correctly (pic 2) when switch axis type to logarithmic. Something i’m likely to get is on pic 3 .
thanks in advance
- Alexander Volkov asked 6 years ago
- last active 6 years ago
Hi
I was trying to bind DoubleRange type property to the VisibleRange property of LogarimethicNumericAxis.
Since DoubleRange is not a primitive type, OnPropertyChanged command didn’t work in c#.
Is there any way to reslove this problem?
My code is as below.
in View
<sci:SciChartSurface.XAxis>
    <sci:LogarithmicNumericAxis AutoRange="Never"
        DrawMajorGridLines="False"
        DrawMinorGridLines="False"
        DrawMajorBands="False"
        Visibility="Visible"
        VisibleRange="{Binding Path=AxisVisibleRange,Mode=OneWay, UpdateSourceTrigger=PropertyChanged}">
    </sci:LogarithmicNumericAxis>
</sci:SciChartSurface.XAxis>
in View model
public DoubleRange AxisVisibleRange
{
    get
    {

        DoubleRange dr = new DoubleRange(0.1,100);
        return dr;

    }
}
- Yungjun Yoo asked 7 years ago
- last active 7 years ago
Hello,
When do you expect Android Chart 1.3 to be ready for delivery? I really need the logarithmic chart capability.
Thanks,
Mike Reed
- Michael Reed asked 8 years ago
- last active 8 years ago
Hi !
Does the android version of SciChart feature logartihmic axis scaling ?
- Adrien De Coninck asked 8 years ago
- last active 8 years ago
Hi,
I’m having difficulties understanding the behaviour of a graph with the following axes:
<s:SciChartSurface.XAxis>
                            <s:LogarithmicNumericAxis DrawMajorBands="False"
                                                      LogarithmicBase="10"
                                                      VisibleRange="0.01,5"
                                                      DrawMinorGridLines="False"
                                                      DrawMajorGridLines="False">
                            </s:LogarithmicNumericAxis>
                        </s:SciChartSurface.XAxis>


                        <s:SciChartSurface.YAxis>
                            <s:NumericAxis  DrawMinorGridLines="False"
                                            DrawMajorGridLines="False"
                                            AxisAlignment="Left"
                                            VisibleRange="{Binding FftDroiteGaucheYAxisRange, UpdateSourceTrigger=PropertyChanged}"/>
                        </s:SciChartSurface.YAxis>
With XAxis VisibleRange set to “0.01,5” the graph looks like this:
When I change it to a bigger range say “0.01,11” or more FOR THE SAME DATA it gets deformed and looks like:
I tried removing VisibleRange in YAXis but it doesn’t seem to work. Please help.
- Kilosa Magali asked 8 years ago
- last active 8 years ago
Hi All,
I have a situation where the chart needs to be switched between a log scale and a linear scale. To solve this I created 2 axis (one of each) and collapse one of them while the other is visible. The user can switch between them from a context menu.
I declare them in XAML as:
            <s:SciChartSurface.YAxes>
            <s:NumericAxis x:Name="LinearAxis" Id="LinearAxisID" AutoRange="Always" AxisAlignment="Left" AxisTitle="Linear" Style="{StaticResource LinearScaleStyle}" Visibility="Visible" GrowBy="0.0, 0.1"/>
            <s:LogarithmicNumericAxis x:Name="LogAxis"  Id="LogAxisID" AxisAlignment="Left" AxisTitle="Log" Style="{StaticResource LogScaleStyle}" GrowBy="0.0, 0.1" />
        </s:SciChartSurface.YAxes>
THE ISSUE:
I’ve noticed that the Major and Minor gridlines are drawn based on the order the Axis are declared in <s:SciChartSurface.YAxes> which isn’t a problem. The problem comes when I collapse one axis and make the other visible (obviously re-assigning the series to the visible axis by ID) – The axis and data change as you might expect but the major and minor gridlines are not redrawn.
In summary, if you start with log gridlines, you always get log gridlines – even on a linear axis.
Is there a way to force the redrawing of the gridlines?
- Stuart McCullough asked 9 years ago
- last active 5 years ago
Hi All,
This is a very similar issue to the following forum entry – the only difference being that I’m using a StackedColumnRenderableSeries rather than a FastColumnRenderableSeries :
I gathered from the above that there may be a problem with small data values but I’ve been using a set of test points ranging in value from 10 to 50 (although ultimately i’ll be using values in the e-5 range) and have tried setting the ZeroLineY value as suggested but to no avail. Following Nazar’s comments in the other forum entry, it seems there is something to do with calculating a value from the column width and I’m wondering if the side-by-side nature of the StackedColumnRenderableSeries has something to do with the problem.
I put a single series on the chart and it displays as expected – all I then do is change the axis type in the XAMl as follows:
            <!-- WORKING but obviously doesn't display in log format -->
        <s:SciChartSurface.YAxis>
            <s:NumericAxis AutoRange="Always" AxisAlignment="Left" AxisTitle="Pressure" ScientificNotation="E" TextFormatting="#.#E+0" CursorTextFormatting="#.#E+0" GrowBy="0.0, 0.1"/>
        </s:SciChartSurface.YAxis>

        <!-- NOT WORKING creating blank chart devoid of even the gridlines -->
        <s:SciChartSurface.YAxis>
            <s:LogarithmicNumericAxis AutoRange="Always" AxisAlignment="Left" AxisTitle="Pressure" TextFormatting="#.#E+0" CursorTextFormatting="#.#E+0" GrowBy="0.0, 0.1"/>
        </s:SciChartSurface.YAxis>
I’m on version 3.4.0.6319 – I’ve just realized that one of my last posts was fixed by a later release and I should have checked that first. oh well, I’m here now!!!
Any ideas anyone?
/Stu
- Stuart McCullough asked 9 years ago
- last active 9 years ago
I have an issue with LogarithmicNumericAxis and FastColumnRenderableSeries. If replace one of FastLineRenderableSeries with FastColumnRenderableSeries in Logarithmic Y-axis SciChart example you’ll receive empty chart (the same behaviour in my application). Only if disable logarithmic on both x and y axis the columns (and lines) appears. How to make LogarithmicNumericAxis with columns work?
Thanks!
- Yury Tolstoguzov asked 9 years ago
- last active 9 years ago
I’m trying to use LogarithmicNumericAxis for y-axis. But when chart has a small range of values (for a example, from 32 to 41) the axis became a empty.
- Ivan Zakharov asked 10 years ago
- last active 10 years ago
