Hi,
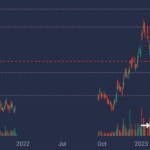
i have some candles and i want to force the chart for removing candles with
open = Double.NaN
high = Double.NaN
low = Double.NaN
close = Double.NaN
openTime – special day (timestamp)
What I see:
- Vahid Garousi asked 1 year ago
- last edited 1 year ago
 Hi Vahid, that looks like you’ve done the correct thing (set Open, High, Low, Close = NAN) and the candles are removed as expected? What is it you wanted to achieve?
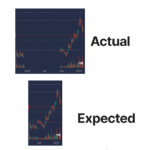
 I wanted these spaces to be completely removed so I don’t see empty space between the candles (with data) on the chart.
 I have attached another photo to make it clearer.
- You must login to post comments
I have sent a picture to make it clearer.
I want to draw the following chart
- Vahid Garousi answered 1 year ago
- last edited 1 year ago
- You must login to post comments
Hi Vahid
Understand the problem now. You are using the Finance.Android open source financial charts library by the look of it, is that right?
This by default is using the DateAxis type in SciChart. DateAxis is useful for cryptocurrency data which trades 24/7, but not for stock market or forex data which can have gaps in it.
For that you need a different axis type, like IndexDateAxis or CategoryDateAxis,
I’m going to talk with the team and see if we can improve this because IndexDateAxis should be used by default in the finance library. That will collapse gaps in stock/forex data
Best regards
Andrew
- Andrew Burnett-Thompson answered 1 year ago
- last edited 7 months ago
- You must login to post comments
Hi, yes, that is absolutely true.
Could you please let me know the outcome of your conversation with the team?
- Vahid Garousi answered 1 year ago
- You must login to post comments
In the source code of Finanace Android, a branch with the name of solving the problem of chat has been created.
If this branch has solved the problem, please release it
thanks a lot
- Vahid Garousi answered 1 year ago
- You must login to post comments
Please login first to submit.


