Does Scichart Android have a function to import 3D models (.obj, .cad…)?
- Hyunji Jeon asked 2 years ago
Is it possible to add color gradients to part of the mesh on an ObjectModel3D? We would love to use SciChart exclusively for our charts because they are easy to work with and almost all of the other charts in our software are SciChart charts.
Currently, we use LightningCharts for our 3D heads and the have a method call UpdateFill which applies a color gradient to part of the mesh. This shading is done using the geometry data generated from LightningCharts after the head is rendered. I didn’t see a similar method in SciChart but I don’t know that it is necessary because the geometry will be the same ever time the chart is rendered so we can just use the data generated from LightningCharts.
I’ve included a screenshot showing what I’ve been able to create with SciChart and a screenshot showing what the chart looks like currently with LightningCharts. The brain is a .obj file (along with the scalp and face but those are separate and don’t require any shading). The sensor locations (Fp1, Fp2, O1, and O2) are added using the ScatterRenderableSeries3D (I haven’t added annotations for the locations yet).

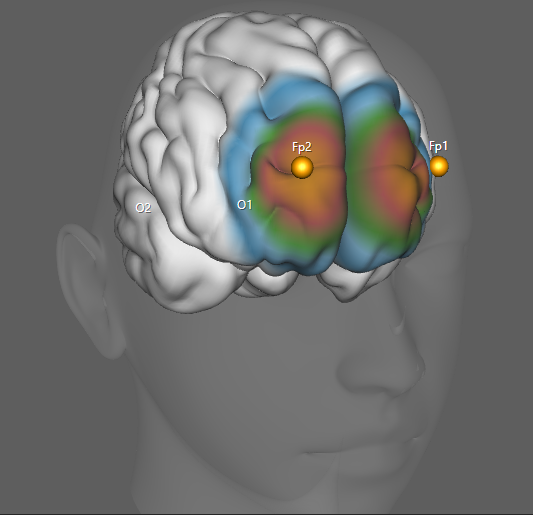
- Tim Stephansen asked 2 years ago
Greetings!
I am interested in drawing lines segments/cylinders on a WPF 3D plot in a manner that allows them to be selected or allow hit testing. I have looked at:
1) Selecting a vertex on a SciChart3DSurface, but I need to select the line
2) Drawing CylinderPointMarker3D’s but I need to set the length of each one
These lines only need to be drawn in the XY, XZ, and YZ planes so I have thought about using the ImpulseRenderableSeries3D but I need to control where the line segments start and end – and this doesn’t look like it allows control of the start.
Any ideas?
–Jonathan
- Jonathan Trumbull asked 3 years ago
- last active 3 years ago
Hello SciChart-Team,
I noticed that the columns in Sparse Column3D and in Uniform Column 3D always start at the XZ surface. Is there any option or way to do so, that columns always use the zero value of the Y axis as their starting point. The visible range of the axes should correspond to the minimum and maximum Y values.
The current behavior can be reproduced in the example SciChart_UniformColumn3D:
If the VisibleRange of the Y-axis goes from 0 to 0.5 then the columns with negative values go down (see screenshot 1)
As soon as the VisibleRange of the Y-axis goes from -0.5 to 0.5, the columns look like this (Screenshot2) We need the columns to look like in Screenshot 1, only that the Y-axis is also visible downwards.
Can the starting point of the columns be changed?
Best regards
Silvester
- Silvester Schneidt asked 3 years ago
- last active 1 year ago
Hi, SciChart:
I have an issue with the AxisTitle of 3D chart, Chinese text could not show correctly.
I can find similar issue as this, but with no solution. https://abtsoftware.myjetbrains.com/youtrack/issue/SC-5809
It would be very kind to let me know if you have any solution.
Thank you!
- Hugo Chu asked 3 years ago
- last active 3 years ago
I have a custom chartmodifier I use for highlighting points on mouseover for my 2D plots and I want to create the same functionality for my 3D scatter plot. However, I can’t get it to work;
for the 2D plot I do
var series = ParentSurface.RenderableSeries[0];
var pt = GetPointRelativeTo(e.MousePoint, ModifierSurface);
double dataPointRadius = 8;
var result = series.HitTestProvider.HitTest(pt, dataPointRadius);
However, it seems that 3D plots don’t have a hittestprovider and that it’s not possible to define a radius for the hit test, so the code becomes
var series = ParentSurface.RenderableSeries[0];
var pt = GetPointRelativeTo(e.MousePoint, ModifierSurface);
var result = series.HitTest(pt);
However, result.IsHit is always false. What am I missing?
- Troels Jensen asked 3 years ago
Hi, we got performance problems with 3D chart on UniformGridDataSeries3D when size of mesh is bigger than 400×400.
The rendering is fine, but it have weird behavior when controlling from mouse: rendering is lags behind mouse movement and it’s hard to rotate the surface accurate.
To reproduce it you can use SciChart_SurfaceMesh3DNonUniformData scichart example and set the surface size to 500×500 for example.
Perfectly we are planning to use 1500×1500 mesh but currently we had to downsample it to 250×250.
Is there is some workaround for this?
Thanks
- Dmitry Halka asked 4 years ago
- last active 4 years ago
Hi, on our data SciChart3DSurface seems a bit laggy while rotating camera, FPS is low. What are general way to improve SciChart3DSurface performance?
- Dmitry Halka asked 4 years ago
- last active 2 years ago
Hi, how do I disable Visual Xccelerator Engine for SciChart3DSurface?
I tried with the following code
<s3D:SciChart3DSurface x:Name="View3D" s:VisualXcceleratorEngine.IsEnabled="False"/>
But it gives compilation error:
Property ‘IsEnabled’ is not attachable to elements of type ‘SciChart3DSurface’.
So how do I generally enable/disable Visual Xccelerator Engine for SciChart3DSurface?
- Dmitry Halka asked 4 years ago
- last active 4 years ago
Hi,
I’ve been testing the CAD objects option in the 3D chart API recently, and been wondering if there’s a way to control some of the objects properties after it is loaded, for example changing it’s position or rotation to simulate movement. I’ve tried to set these properties for a certain object I’ve loaded in the code behind with a DispatcherTimer, but it did not affect any of the properties I’ve tried to modify in my Tick event handler. Is there a proper way to achieve it?
Thank you!
- Ilan Rozen asked 4 years ago
Hi,
I’ve the following problem.
We have an application where we have many spectrums (frequency or order spectrums). To get a better overview and to select one for a more detailed analysis, we would like to display them as a waterfall chart. A spectrum always has a high resolution of 32768 points. If I now display between 60 and 100 spectrums in a waterfall chart, it takes quite a long time to render this and it is almost impossible to operate the chart.
However, a high-resolution spectrum is not required for a good overview in the waterfall diagram. Therefore my idea is to resample every single spectrum to e.g. 8192 points and then display it in the waterfall diagram.
Is there a possibility to use the internal SciChart resampler (e.g. Min/Max) or do I have to develop an own algorithm for this?
Or does a similar function already exist in SciChart?
Thanks
- Ingo Fiedler asked 4 years ago
- last active 4 years ago
Hi,
Is it possible to show contour of bars in ColumnRenderableSeries3D?
Is there way to do this?
ColumnRenderableSeries3D has a Stroke property, but does not appear to have any effect on setting this property.
best regards
Silvester
- Silvester Schneidt asked 4 years ago
- last active 4 years ago
Hi,
I would like to ask whether it is possible to reduce the default margins around the 3D plane cube on 3D plots? I realize that I can change it by relocating the camera and with ZoomModifier but, once the ZoomExtents() is called, the margins are restored back. I attached here a screenshot with the green line showing the margin area that I mean.
Thank you in advance!
- corvex asked 4 years ago
- last active 4 years ago
Is it possible to set different color to axis ticks and axis title.
In 2D-Chart i did it by changing the style of DefaultTickLabel:
<Style x:Key="NumericAxisForMvvm" TargetType="axis:NumericAxisForMvvm">

  <Setter Property="FontSize" Value="12" />
  <Setter Property="FontFamily" Value="Arial" />
  <Setter Property="FontWeight" Value="Bold" />
  <Setter Property="TickTextBrush" Value="Red" />

  <Setter Property="TickLabelStyle">
    <Setter.Value>
      <Style TargetType="s:DefaultTickLabel">

        <Setter Property="FontSize" Value="16" />
        <Setter Property="FontWeight" Value="Normal" />
        <Setter Property="FontFamily" Value="Courier New" />
        <Setter Property="Foreground" Value="Blue" />

        <Setter Property="Template">
          <Setter.Value>
            <ControlTemplate TargetType="s:DefaultTickLabel">
              <ContentControl Content="{Binding}"
                              ContentTemplate="{TemplateBinding ContentTemplate}"
                              IsTabStop="False"
                              Foreground="{TemplateBinding Foreground}"
                              FontFamily="{TemplateBinding FontFamily}"
                              FontSize="{TemplateBinding FontSize}"
                              FontWeight="{TemplateBinding FontWeight}"/>
            </ControlTemplate>
          </Setter.Value>
        </Setter>
      </Style>
    </Setter.Value>
  </Setter>
</Style>
Same procedure seems doesn’t work for 3D-Charts.
How can i achieve this?
Is that currently possible?
Best Regards
Silvester
- Silvester Schneidt asked 4 years ago
- last active 4 years ago
Hi!
I am trying to implement a custom ViewportManager for a SciChart3DSurface, but the overridden methods, such as OnCalculateNewXRange are not called after I assign the custom ViewportManager to a surface. The minimalistic version of my code is:
public class Test3DViewportManager : ViewportManager3DBase
    {
    public Test3DViewportManager() : base()
        {
        }

    public override void OnParentSurfaceRendered(ISciChart3DSurface sciChartSurface)
        {
        base.OnParentSurfaceRendered(sciChartSurface);
        }

    protected override IRange OnCalculateNewXRange(IAxis3D xAxis)
        {
        return base.CalculateAutoRange(xAxis);
        }


    protected override IRange OnCalculateNewYRange(IAxis3D yAxis, RenderPassInfo3D renderPassInfo)
        {
        return base.CalculateAutoRange(yAxis);
        }


    protected override IRange OnCalculateNewZRange(IAxis3D zAxis, RenderPassInfo3D renderPassInfo)
        {
        return base.CalculateAutoRange(zAxis);
        }
    }
I tried to assign the custom manager is two different ways in code-behind, none of them work:
var VM= new Test3DViewportManager();
SciChart.ViewportManager = VM;  // way 1
VM.AttachSciChartSurface(SciChart); // way 2
I would appreciate any suggestion, thanks in advance!
- corvex asked 4 years ago
- last active 4 years ago
When the GrowBy property on NumericAxis3D is specified, a tooltip modifier on the same 3D chart shows over data points that are not those under the mouse pointer.
To replicate the issue:
-
Clone the examples project from GitHub and open the SciChart2D3D.Examples solution.
-
In UniformColumn3D.xaml change the XAxis, YAxis, ZAxis and ChartModifier elements to the following, from line 101 onwards:
<s3D:SciChart3DSurface.XAxis> <s3D:NumericAxis3D AutoRange="Always" /> </s3D:SciChart3DSurface.XAxis> <s3D:SciChart3DSurface.YAxis> <s3D:NumericAxis3D AutoRange="Always" /> </s3D:SciChart3DSurface.YAxis> <s3D:SciChart3DSurface.ZAxis> <s3D:NumericAxis3D AutoRange="Always" /> </s3D:SciChart3DSurface.ZAxis> <s3D:SciChart3DSurface.ChartModifier> <s3D:TooltipModifier3D HoverDelay="150" CrosshairMode="Lines" ShowTooltipOn="MouseOver" /> </s3D:SciChart3DSurface.ChartModifier> -
Run the application and observe that the 3D Charts -> Basic Chart Types -> Uniform Column 3D chart shows a chart with correct tooltips appearing when the mouse is hovered over columns on the chart.
-
Add GrowBy=”0.1, 0.1″ to each axis property as follows:
<s3D:SciChart3DSurface.XAxis> <s3D:NumericAxis3D AutoRange="Always" GrowBy="0.1,0.1" /> </s3D:SciChart3DSurface.XAxis> <s3D:SciChart3DSurface.YAxis> <s3D:NumericAxis3D AutoRange="Always" GrowBy="0.1,0.1" /> </s3D:SciChart3DSurface.YAxis> <s3D:SciChart3DSurface.ZAxis> <s3D:NumericAxis3D AutoRange="Always" GrowBy="0.1,0.1"/> </s3D:SciChart3DSurface.ZAxis> -
Run the application again and hover the mouse over the same chart. Note that the tooltop is now shown for a data point different to whichever one the mouse is over at the time, which is incorrect.
- Stephen Hewlett asked 5 years ago
- last active 4 years ago
I’ve just downloaded the new v6 SDK and tried to use the tooltip feature both in my existing application and in the examples suite, and in both cases tooltips do not appear at all. The example suite for both .NET Framework and .NET Core crashes and the solution export feature produces a solution that does not build in Visual Studio.
The first example, 3D Charts -> Tooltips and Hit Test 3D Charts -> Series Custom Tooltips 3D Chart, crashes the example suite if I hover over a data point. The application closes with no error message.
The second example, 3D Charts -> Tooltips and Hit Test 3D Charts -> Series Tooltips 3D Chart, does not show any tooltips at all, in contrast to the same example from the v5 example suite. The application in this case does not crash, though.
In my own application the tooltip does not show whereas with the previous version of SciChart it did. I cannot see an exception raised.
- Stephen Hewlett asked 5 years ago
- last active 5 years ago
I am trying to modify the 3D Charts > Tooltips and Hit Test 3D Charts > Series Tooltips 3D Chart example to change the colour of the tooltip crosshairs to red. By crosshairs I mean the green lines in the image attached.

I modified SeriesTooltips3DChart.xaml by adding:
    <UserControl.Resources>
        <Style x:Key="MyCrosshairOverlayStyle" TargetType="Line">
            <Setter Property="Stroke" Value="Red" />
            <Setter Property="StrokeThickness" Value="2" />
        </Style>
        <Style x:Key="MyCrosshairProjectionStyle" TargetType="t3D:CrosshairLines">
            <Setter Property="CrosshairOverlayStyle" Value="{StaticResource MyCrosshairOverlayStyle}" />
            <Setter Property="ProjectionMode" Value="Crosshair" />
        </Style>
    </UserControl.Resources>
and modifying the TooltipModifier3D element:
<t3D:TooltipModifier3D CrosshairMode="Lines" CrosshairPlanesFill="#33FF6600" CrosshairProjectionStyle="{StaticResource MyCrosshairProjectionStyle}" />
I expected this to apply the coloured lines but it did not. What have I misunderstood?
- Stephen Hewlett asked 5 years ago
- last active 5 years ago
Does SciChart provide a built-in way to display multiple data series on the same 3D chart where the series do not share a common unit or order of magnitude? On a 2D chart I would use a second y-axis via the YAxes collection but I can’t find an equivalent property on the SciChart3DSurface class.
- Stephen Hewlett asked 5 years ago
- last active 5 years ago
Hi SciChart Team,
Is it possible to turn on anti aliasing for the major grid lines in 3D Surface?
The rendered lines in Chart look good, but the major grid lines look like they are built from the small strokes.
- Silvester Schneidt asked 5 years ago
- last active 5 years ago
Hello. How to draw a plane through 3 points on WPF 3D Point Cloud Chart?
- Sergei Kolobov asked 5 years ago
- last active 5 years ago
Hi,
3d Surface Chart
I have read the announcement for 3d charts on iOS and Android. That’s exactly me requirement.
Is a release date already planned or is a beta version available?
What are the limitations for a 3d chart on Android (number of points, memory consumption, time to create the view).
We need a 3d surface chart with x=400 points and y= ~1000point (400’000 points).
- Is this possible?
- Can this chart be rotated fluid?
2d Chart
I have a requirement for a 2d chart on Android.
The user must be able to move some points in a line chart. Like “design” a set curve.
- Is this possible?
- Exist’s some codes samples?
Best regards
Urs
- Urs Geser asked 5 years ago
- last active 5 years ago
Hi!
I’ve tried to access the values to print them in a different view, but I cant reach them. So my question is there a specific way to reach them?
- Robin Bergqvist asked 5 years ago
- last active 5 years ago
Hello,
we are currently using SciChart 2D in our Application. I got the request to provide a 3D representation of one of our charts, so I started to download the newest Version of SciChart to get a trial on the 3D charts. I included the dll’s to our application and reworked the code to show a 3D chart instead. I think the code will work, but in our application I can’t see a chart. I just see a black rectangle (See attachement) with a text that 3D charts are only available in the 3D or SDK editions.
Can you help me?
Thanks,
Joerg
- Joerg Hoehn asked 6 years ago
- last active 6 years ago
Dear all
When the binding data is changed in real time to the ColumnRenderableSeries, the pointer size of the corresponding series is changed to an arbitrary size.
ColumnRenderableSeries wants to know if it can fix the size when the x and z axes are changed in real time.
Or, I want to know if there is a function that can calculate the position of xyz in 3D chart and adjust the height of the corresponding pointer.
Thank you for your reply.
- Lee JunHee asked 7 years ago
- last active 7 years ago
I’ve had great success showing pixel values of a 2D image using the UniformDataSeries3D type. What I’d like to do now is display a subset of the pixel values in an image using a rectangular region of interest. However, it seems that the axes always start from 0. If I want to have the axes to not begin at value 0, will I have to calculate points for the whole image and zoom in? Or is there a way to set what the starting value of the axes are (while still indexing the values at index 0)
- [email protected] asked 7 years ago
- last active 7 years ago
Hello,
I would like to know if there is a possibility to export 3d charts to XPS format. I’ve tried using ExportToFile extension method:
sciChart.ExportToFile(filePath, ExportType.Xps, true);
While this method works well on 2d chart, it throws an exception:
InvalidCastException: Unable to cast object of type ‘SciChart.Charting3D.SciChart3DSurface’ to type ‘SciChart.Charting.Visuals.SciChartSurface’.
Stack Trace:
at SciChart.Charting.Visuals.SciChartSurfaceBase.CreateCloneOfSurfaceInMemory(Size newSize)
at SciChart.Charting.Visuals.SciChartSurfaceBase.ExportToFileInternal(String fileName, ExportType exportType, Boolean useXamlRenderSurface, Nullable`1 size)
at SciChart.Charting.Visuals.SciChartSurfaceBase.ExportToFile(String fileName, ExportType exportType, Boolean useXamlRenderSurface)
…
It suggests there is no way to export 3d charts, am I correct?
- Wojciech asked 7 years ago
- last active 7 years ago
Hi,
I’ve created a 2D Heatmap Chart which works for itself perfectly fine (incl. x-y zooming, panning, annotations, etc.), but once I’ve added a 3D chart (even without any datapoints), the behaviour of my Heatmap chart changes. After a double click on the chart, the displayed range changes. The zoom and pan direction works only in yDirection, new created annotations are not displayed correctly anymore, previous annotations disappear, when I try to move them.
Does anyone have an idea what the problem might be?
Each chart (2D Heatmap and 3D Pointcloud) has its own view and viewmodel.
In the images below you can see the 3D chart (which I more or less copied from the examples).
The image on the right shows the heatmap chart before I created the 3D chart view. During that phase everything works fine.
The image in the middle is showing the heatmap after the 3D chart view was created.
In the meantime there is not happening much in the code. There is a message that the 3D Libraries are initialized (“INITIALIZING NATIVE LIBS IN SC3DS CTOR”). That sounds quite normal to me.
Thanks in advance,
Tim
- Tim asked 8 years ago
- last active 8 years ago
I’m using the shiny new 3D capabilities and wanted to know if the X(red), Y(green), Z(blue) axis orientation indicator can be removed from a chart.
Looked for a property on the SciChart3DSurface and Camera3D but didn’t find anything.
Is it a “always present in demo” thing?
Thanks
- Mark Attwood asked 8 years ago
- last active 8 years ago
Is there any solution to catch the following fatal error, while trying to open any 3D chart in examples suite?

Thank you in advance!
- Konstantin Brownstein asked 8 years ago
- last active 8 years ago
Needing a 3D Plot for only around 100 points.
There is a SciChart3D nuget available for download but without any example.
Has anyone used it and can provide an example to me.
thx
- Bürger Martin asked 9 years ago
- last active 8 years ago
