This might be a feature request, I don’t know. Basically, I’m trying to plot a 3D scatter-plot and programmatically insert an arbitrary number of partially transparent free surface meshes in the same area as the scatter-plot. I started small and made some spheres. Some of my points are inside the spheres. These points are important, and I have my own functions that detect collisions between points and the spheres. The scatter-plot is also dynamic, where I update the color and transparency of the points and this means something. When all of the points are completely opaque, I get the desired behavior where I can see the points inside and behind the partially transparent meshes. However, when I make even one point transparent, all of the points inside and behind the mesh stop rendering. This is really annoying. Deletion is too slow. Is there anyway to force these fully opaque points to continue to render inside the partially transparent mesh while their brothers in the scatter-plot data series are transparent?
Second question, while I’m here. I’ve bolted a UI to the side of the Sci-Chart environment. What is the best way to make sure that the UI stays responsive even if the Sci-Chart environment starts to slow down? I want to crank up the point count past any reason.
https://www.youtube.com/watch?v=0IBBG6WEQw8 I’ve also uploaded a video of my problem. Before I check the box “Draw Geo-fence Violations Only”, all points in the data series 100% not transparent. When I check the box, all the white points start to become 100% transparent. When I click “Draw Geo-fences”, the meshes become 100% transparent (it’s backwards I know). The points are obviously still within the bounds of the mesh, as when the I turn off the mesh they start rendering. You can also see some red dots outside the mesh, as my program flagged a few points right next to the mesh as being inside it. These red dots outside the mesh render even when the red dots inside the mesh don’t.
- Will Wright asked 2 years ago
- last active 2 years ago
Is it possible to add color gradients to part of the mesh on an ObjectModel3D? We would love to use SciChart exclusively for our charts because they are easy to work with and almost all of the other charts in our software are SciChart charts.
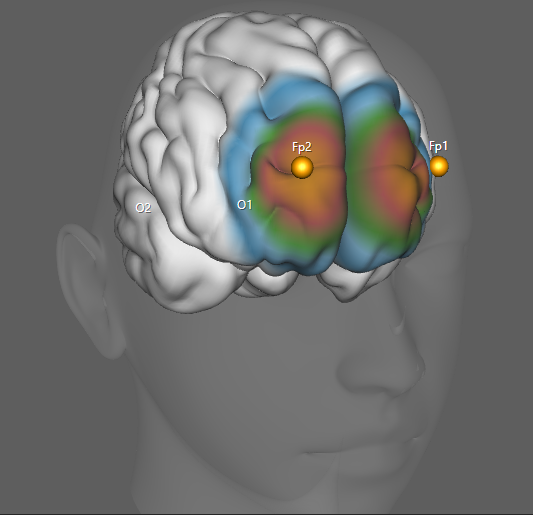
Currently, we use LightningCharts for our 3D heads and the have a method call UpdateFill which applies a color gradient to part of the mesh. This shading is done using the geometry data generated from LightningCharts after the head is rendered. I didn’t see a similar method in SciChart but I don’t know that it is necessary because the geometry will be the same ever time the chart is rendered so we can just use the data generated from LightningCharts.
I’ve included a screenshot showing what I’ve been able to create with SciChart and a screenshot showing what the chart looks like currently with LightningCharts. The brain is a .obj file (along with the scalp and face but those are separate and don’t require any shading). The sensor locations (Fp1, Fp2, O1, and O2) are added using the ScatterRenderableSeries3D (I haven’t added annotations for the locations yet).

- Tim Stephansen asked 2 years ago
Hi, we got performance problems with 3D chart on UniformGridDataSeries3D when size of mesh is bigger than 400×400.
The rendering is fine, but it have weird behavior when controlling from mouse: rendering is lags behind mouse movement and it’s hard to rotate the surface accurate.
To reproduce it you can use SciChart_SurfaceMesh3DNonUniformData scichart example and set the surface size to 500×500 for example.
Perfectly we are planning to use 1500×1500 mesh but currently we had to downsample it to 250×250.
Is there is some workaround for this?
Thanks
- Dmitry Halka asked 4 years ago
- last active 4 years ago
