Hello.
I have real-time chart. It updates and X-axis always moving. When I added annotation like VerticalLineAnnotationViewModel to chart I choose the certain point on X-axis and after adding annotation it start moving with X-axis. It is OK.
But now I need to add VerticalLineAnnotationViewModel with calculated point on X-axis. I will be looks like constant static vertical line on moving chart. Can I make something like this?
- Fedor Iudin asked 1 month ago
- last active 1 month ago
Hello,
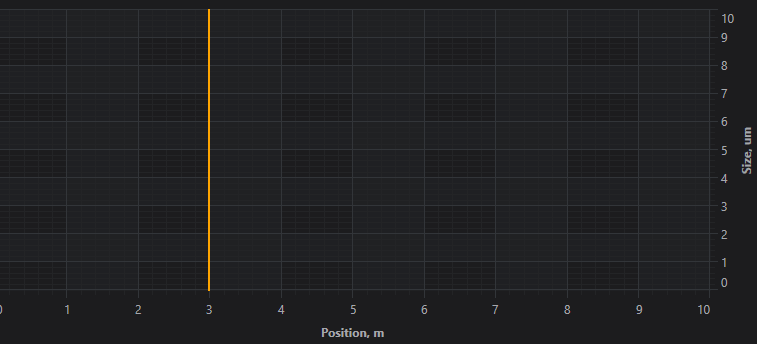
I have this
private readonly string CHART_MARKER_TEXT = "Marker";
private readonly string CHART_MARKER_STYLE = "VerticalLineAnnotationStyle"; // defined in Chart.xaml

    AddVerticalLineAnnotation(new AnnotationRequest() { XValue = 3, LabelText = CHART_MARKER_TEXT, AnnotationStyle = CHART_MARKER_STYLE });

private void AddVerticalLineAnnotation(AnnotationRequest request)
{
    Annotations.Add(new VerticalLineAnnotationViewModel
    {
        X1 = request.XValue,
        LabelValue = !string.IsNullOrEmpty(request.LabelText) ? request.LabelText : null,
        VerticalAlignment = VerticalAlignment.Stretch,
        LabelPlacement = LabelPlacement.Left,
        LabelsOrientation = System.Windows.Controls.Orientation.Vertical,
        StyleKey = request.AnnotationStyle,
    });
}
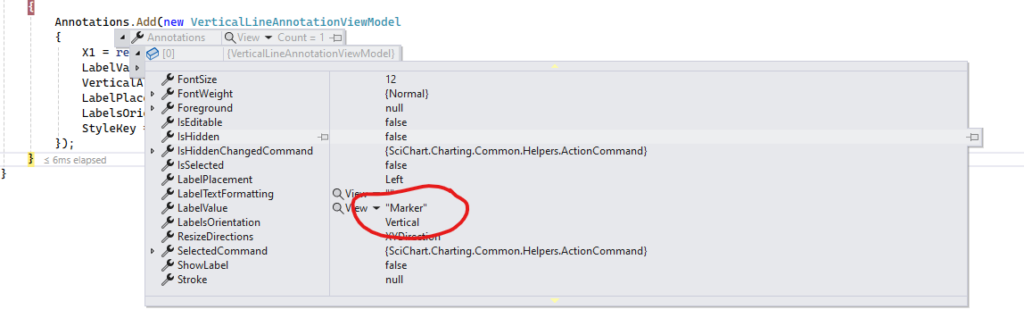
And this
<Style x:Key="VerticalLineAnnotationStyle" TargetType="{x:Type s:VerticalLineAnnotation}">
    <Setter Property="Stroke" Value="Orange" />
    <Setter Property="StrokeThickness" Value="2" />
    <Setter Property="FontSize" Value="12" />
    <Setter Property="FontWeight" Value="Bold" />
</Style>
Why I can’t see Label?
- Fedor Iudin asked 6 months ago
- last active 6 months ago
Hello,
I am trying to select a single X value on my chart and get the data values from the X value that I selected. I am still pretty new to SciChart but I was looking around and saw that there is a DataPointSelectionModifier. My goal is to create a VerticalLineAnnotation for the user to use and once that annotation is created, to pull the data values from that X value. Could this be done? Any advice or help is greatly appreciated!
Thanks,
Preston
- preston truong asked 6 months ago
- last active 6 months ago
I’m having issues with displaying my vertical annotations on my chart. Below is the code for creating the annotation and adding it to the chart.
var annotationLine = new VerticalLineAnnotation();
annotationLine.XAxisId = XAxisID;
annotationLine.YAxisId = YAxisID;
annotationLine.Stroke = new SolidColorBrush(Colors.Blue);
annotationLine.StrokeThickness = 2;
annotationLine.IsHidden = false;
annotationLine.AnnotationCanvas = AnnotationCanvas.BelowChart;
annotationLine.Y1 = 0;
annotationLine.Y2 = ControlHeight;
annotationLine.X1 = xValues[i];
Surface.Annotations.Add(annotationLine);
I have verified that the XAxisId and the YAxisId are correct and match the id of the only axes that I have on the chart
I have verified that the xValues[i] is a valid value on the chart and within the bounds of the viewport
The tricky part here is that I am reading live streaming EEG data from a device and inserting manual triggers into the data. This works fine and the annotations appear in the chart as they are within the bounds of the chart.
I then record that data to a file (currently csv but will be doing EDF as soon as I get this figured out) where the annotation data is present (verified)
It’s when I try to read the file into my application that I can’t get the annotations to appear on the SciChart. I’m using the code above for both the live streaming data (working) and the file reading (not working) so I’m really baffled by this and could use any insight anyone has.
Thank you
- Tom Jorgensen asked 2 years ago
- last active 2 years ago
Hi,
I am using in my chart a VerticalSliceModifer with a VerticalLineAnnotation.
It works as expected, but I would like to modify the aspect of my VerticalLineAnnotation by adding a marker on the axis on top of the line, exactly as in the attached picture (not a scichart).
Is there a way to do that ?
Best regards,
Jean-Charles Durand
- Jean-Charles DURAND asked 4 years ago
- last active 4 years ago
i wanna use vertical line annotation in box annotation that only one edge moves to drag like using ‘chart drag area to zoom’
I checked about custom annotation and there’s features said ‘common features of annotations’ but they don’t have any features l’m looking for
i put pictures for understanding.
there are box annotation on a graph and I want to move line to drag and box is going to smaller or larger
and i also want the other edge is fixed, it can not be dragged
do you guys have any tips for me?
- cy bang asked 4 years ago
- last active 4 years ago
I would like to add an image or icon to the bottom of the Vertical Line Annotation, where the AnnotationLabel is.
Is there a way to do this using the StyleKey?
I have a lot of Vertical Line Annotations and I am trying to make some of them look different other than just color. I need ways to show different vertical line annotations and this could be one of them.
- Ryan Franklin asked 5 years ago
- last active 5 years ago
I have placed a VerticalLineAnnotation on chart surface along with AxisMarkerAnnotation on X-Axis. The X1 of axis marker is bound to the vertical line annotation’s X1 so that they can move together.
I have set IsEditable=”True” and DragDirections=”XDirection” for both – the line annotation & its axis marker so that user can drag the line on chart horizontally by holding the mouse on either the vertical line or its axis marker.
The drag operation works fine when user holds the vertical line with mouse and drags it. The mouse pointer and annotation move together happily.
However, the problem occurs when user holds on the axis marker and tries to drag. In this case, the mouse pointer remains way behind and the annotation moves ahead very fast. There is no sync between mouse pointer position and line annotation which becomes very bad experience for user. Is there any way to address this issue?
- Anil Soman asked 5 years ago
- last active 5 years ago
Hello,
I’m trying to display a vertical line annotation on a chart using MVVM.
In order to make it work I’ve (All the INotifyPropertyChanged are managed via the BaseViewModel)
public class GraphSurfaceBaseViewModel : BaseViewModel
{
    /// <summary>
    /// A list of annotations
    /// </summary>
    public ObservableCollection<IAnnotationViewModel> Annotations { get; private set; }

 ...
}
I create annotation that way
Graph.Annotations.Add(new VerticalLineAnnotationViewModel()
            {
                X1 = TimeOfComment,
                ShowLabel = true,
                StrokeThickness = 2,
                XAxisId = "Xaxis",
                YAxisId = "Yaxis1",
                AnnotationLabels = new ObservableCollection<AnnotationLabel>() { new AnnotationLabel() {Text = "mon test", LabelPlacement = LabelPlacement.TopRight } }

            });
And the binding to the scichartsurface is :
<s:SciChartSurface
...
Annotations="{s:AnnotationsBinding Annotations}"
</s:SciChartSurface>
I’ve double check that my x axis and y axis have the same ID as the annotation.
The problem is I want to display several annotation labels but they are not appearing. I suspect a problem via the AnnotationsBinding which is not taking the AnnotationLabels from the VerticalLineAnnotationViewModel.
What I got :

What I want (paint skill here):

For the what I want, I can draw a simple vertical bar by settings showLabel = false but I suppose that all the label I previously added to the
AnnotationLabels will not be shown, that’s why I let it.
Thank you for any help.
Renaud
- Renaud Danniau asked 5 years ago
- last active 5 years ago
I am trying to add a VerticalLineAnnotation with a text at the bottom to my SciChart graph.
The similar thing works great when the XAxis is a NumericalAxis, but throws an Exception when it is a TimeSpanAxis.
var commentAnnotation = new VerticalLineAnnotationViewModel()
{
    // Setting the LabelValue only works when the XAxis is a NumericalAxis
    // and throws an Exception when it is a TimeSpanAxis
    LabelValue = "vertical line annotation",
    ShowLabel = true,
    // adjust this to '9' when trying it with a NumericalAxis
    X1 = TimeSpan.FromHours(9),
};
AnnotationViewModels.Add(commentAnnotation);
My SciChartSurface looks like this:
<s:SciChartSurface Annotations="{s:AnnotationsBinding AnnotationViewModels}">
    <s:SciChartSurface.XAxis>
        <s:TimeSpanAxis>
            <s:TimeSpanAxis.VisibleRange>
                <s:TimeSpanRange Min="00:00:00" Max="10:00:00" />
            </s:TimeSpanAxis.VisibleRange>
        </s:TimeSpanAxis>
    </s:SciChartSurface.XAxis>
</s:SciChartSurface>
- Matthias Fritsche asked 6 years ago
- last active 6 years ago
Hello! I need to change position of VerticalLineAnnotation label (not the label showing axis value, but the label showing a value of crossed chart). How can I do this?
- Ivan Kozlov asked 6 years ago
- last active 6 years ago
I have a strip chart (see attached image), which uses VerticalLineAnnotation to mark events. I add my own AnnotationLabel with the Text showing the event id, and a ToolTip with detailed event information. I’m currently setting the LabelPlacement as Axis. I like the look of that AnnotationLabel style, but I’d really like it to be above the plot so it doesn’t clutter up the axis. Is there a nice way to do this?
- RogerKilgore asked 6 years ago
- last active 6 years ago
1) About VerticalLineAnnotation, when I move the vertical line, which event I can use to get real time data?
2) Do the chart lib have the full method to calculate the Fast Fourier Transformation?
- kiiv_love Yali asked 6 years ago
- last active 6 years ago
Hi all,
As the title indicates, I am trying to get mouse cursor position (Coordinates) from a SciChartSurface in MVVM manner.
I have lots of data bindings to my chart properties in my View Model in the background. This following snipped is a copy of my XAML code in which I have all the data bindings set:
<sci:SciChartSurface Grid.Row="0" Grid.Column="0"
                         RenderableSeries="{Binding SciChartSeriesViewModels}"
                         Padding="0,8,0,2"
                         sci:ThemeManager.Theme="BrightSpark"
                         YAxes="{Binding SciChartYAxesCollection,Mode=TwoWay}"
                         AutoRangeOnStartup="True"
                         Annotations="{Binding ChartAnnotations}"
                         Name="ApplicationSciChart"
                         ChartModifier ="{Binding ChartModifierGroup}"
                         BorderBrush="LightSlateGray"
                         BorderThickness="1"
                         Visibility="{Binding ChartVisibility}">

        <sci:SciChartSurface.XAxis>
            <sci:TimeSpanAxis AxisTitle="Time"
                              AutoRange="Once" GrowBy="0.03,0.001"
                              TextFormatting=""/>
        </sci:SciChartSurface.XAxis>

  </sci:SciChartSurface>
As can be seen from the code above, the ChartModifier property is one of the items that has Data binding to an instance of a ModiferGroup I have created in my View-Model in the background. The following code is a method that adds members to that ModiferGroup (called ChartModiferGroup in my View-Model):
 private void CreateChartModifiers()
    {
        var rubberBandXyZoomModifier = new RubberBandXyZoomModifier
        {
            ExecuteOn = SciChart.Charting.ChartModifiers.ExecuteOn.MouseLeftButton,
            RubberBandFill = (SolidColorBrush)(new BrushConverter().ConvertFrom("#33FFFFFF")),
            RubberBandStroke = Brushes.SteelBlue,
            RubberBandStrokeDashArray = new DoubleCollection {2.0, 2.0}
        };

        var zoomPanModifier = new ZoomPanModifier
        {
            ExecuteOn = SciChart.Charting.ChartModifiers.ExecuteOn.MouseMiddleButton,
            ClipModeX = SciChart.Charting.ClipMode.None
        };

        var yAxisDragModifier = new YAxisDragModifier
        {
            DragMode = SciChart.Charting.AxisDragModes.Scale
        };

        var xAxisDragModifier = new XAxisDragModifier
        {
            DragMode = SciChart.Charting.AxisDragModes.Pan
        };

        var mouseWheelZoomModifier = new MouseWheelZoomModifier();

        var zoomExtentsModifier = new ZoomExtentsModifier
        {
            ExecuteOn = SciChart.Charting.ChartModifiers.ExecuteOn.MouseDoubleClick
        };

        var cursorModifier = new CursorModifier
        {
            ReceiveHandledEvents = true,
            ShowAxisLabels = false
        };


        var probeline = new VerticalLineAnnotation()
        {
            Stroke = Brushes.LightSlateGray,
            IsEditable = true,
            ShowLabel = true,
            LabelPlacement = LabelPlacement.Axis,
            Visibility = Visibility.Visible,
            IsHidden = false,
            IsEnabled = true,
            X1 = TimeSpan.FromMilliseconds(-100),
            YAxisId = "Triggered",
            StrokeDashArray = new DoubleCollection { 2.0,2.0},
            StrokeThickness = 1
        };

        var verticalSliceModifier = new VerticalSliceModifier
        {
            IsEnabled = true,
            ShowAxisLabels = true,
            Style = probeline.Style
        };
        verticalSliceModifier.VerticalLines.Add(probeline);


        ChartModifierGroup.ChildModifiers.Add(rubberBandXyZoomModifier);
        ChartModifierGroup.ChildModifiers.Add(rubberBandXyZoomModifier);
        ChartModifierGroup.ChildModifiers.Add(zoomPanModifier);
        ChartModifierGroup.ChildModifiers.Add(yAxisDragModifier);
        ChartModifierGroup.ChildModifiers.Add(xAxisDragModifier);
        ChartModifierGroup.ChildModifiers.Add(mouseWheelZoomModifier);
        ChartModifierGroup.ChildModifiers.Add(zoomExtentsModifier);
        ChartModifierGroup.ChildModifiers.Add(verticalSliceModifier);
        ChartModifierGroup.ChildModifiers.Add(cursorModifier);
    }
What I am trying to do next, is to add functionality in my application, such that I can add more VerticalSliceModifiers to my ChartModifierGroup when a button is pressed. In order to do that, I will require having access to the Mouse cursor position of my SciChartSurface to set the X1 property of the VerticalLineAnnotation, that would be used for the VerticalSliceModifiers (to be created).
In simple words, every time I press a button, I need the position of the mouse pointer to get captured and used as the location of the new VerticalSliceModifer that I am going to create.
I have already read many of the examples and documentation of Sci-Chart such as: Vertical Slice Tooltips Example. However, in this example, the mouse pointer location is accessed is under the xaml.cs and not inside an actual View-Model.
I was wondering if anybody could let me know how I can get access to my SciChartSurface mouse pointer position using true MVVM model.
- Ehsan Masnavi asked 7 years ago
- last active 5 years ago
I am have a vertical stacked chart setup which shares the same x- axis ranges. I am trying to find a way to add vertical lines in both the charts at once and further I need the vertical lines to be dragged in sync. When one vertical line annotation is dragged, I need the same movement to happen in the other chart as well. I can share a prototype if you want. Please suggest a solution.
- Biju Pillai asked 7 years ago
- last active 7 years ago
Hi,
I’m trying to enable the use of multiple VerticalLineAnnotations and show the corresponding SeriesInfo in an extra legend to the user. Utilizing the RolloverModifier Tooltips example, this works quite easily for the position and values of the VerticalLineAnnotations. However, I would like to show differences (X and Y) between the values of two VerticalLineAnnotations in the same manner.
My approach was to subclass ChartDataObject and add an ObservableCollection of a custom class (SeriesDifferenceInfo) providing properties, which exhibit DeltaX and DeltaY for binding in the surface. For keeping this collection up to date when adding or removing a VerticalLineAnnotation, I registered for the CollectionChanged event of SeriesInfo in my subclassed ChartDataObject and wanted to update the Collection of SeriesDifferenceInfo subsequently. But somehow this event appears not to be triggered on a change in the list of SeriesInfo. Am I doing something wrong or is this intended behaviour? Of course, I could simply call a method UpdateDifferenceCollection(), when adding/removing a VerticalLineAnnotation, but is this really neccessary?
Also, the next problem is triggering PropertyChanged for the DeltaX and DeltaY values when the values of one SeriesInfo changed. I guess this could be done by listening to e.g. a drag event of VerticalLineAnnotation, but is there a more straightforward way to do this?
Best regards
Phil
- Philipp Gregor asked 7 years ago
I did modify this CustomAnnotationChartModifier. I added a databinding to bing the ShowLabelProperty to the IsSelectedProperty.
    // Recreate all annotations, called when LabelsSource property changes or when the
    // CustomAnnotationChartModifier is attached to the parent surface
    private void RebuildAnnotations() {
        if (base.ParentSurface == null || LabelsSource == null)
            return;
        var annotationCollection = base.ParentSurface.Annotations;
        annotationCollection.Clear();
        foreach (var item in LabelsSource) {
            var vla = new VerticalLineAnnotation();
            vla.DataContext = item;
            vla.SetBinding(AnnotationBase.X1Property, new Binding("X1") { Mode = BindingMode.OneWay });
            // bind ShowLabelProperty
            vla.SetBinding(VerticalLineAnnotation.ShowLabelProperty,
                new Binding("IsSelected") { RelativeSource = RelativeSource.Self, Mode=BindingMode.OneWay });
            vla.IsEditable = this.IsEditable;
            // after manipulation: write X1Property back to Viewmodel
            vla.DragEnded += Annotation_DragEnded;
            vla.LabelPlacement = LabelPlacement.Top;
            // test to set directly ShowLabel = (bool)e.NewValue;
            //vla.Unselected += annotation_SelectionChanged;
            //vla.Selected += annotation_SelectionChanged;
            if (this.MarkerManipulatedCommand != null)
                vla.ManipulationCompleted += new EventHandler<ManipulationCompletedEventArgs>(manipulationCompleted_EventHandler);
            annotationCollection.Add(vla);
        }
    }

    private void annotation_SelectionChanged(object sender, EventArgs e) {
        var vla = sender as VerticalLineAnnotation;
        if (vla == null) return;
        vla.ShowLabel =vla.IsSelected;
    }
Result: Select the annoation will show the label. Unselect will not remove the label.
I did try the unselected and selected-event to do the same on other way ->same result.
I can see also that each new selection lighter the label (is it shown more than one time?).
How can I add ToolTipLabel inside that CustomAnnotationChartModifier to see the y-values?
Frank
- Frank Albert asked 8 years ago
- last active 8 years ago
I am building a real-time graph with CategoryDate X Axis and Numeric Y Axis. I found it hard to understand the Annotation API’s regarding the X and Y positions.
Q1:
Looking at AnnotationsAreEasyFragment, it draw a Horizontal line of (seemingly) full width. it declares
sciChartBuilder.newHorizontalLineAnnotation()
    .withPosition(7d, 2.8d)
    .withStroke(2, ColorUtil.Orange)
    .build()
i can under Y = 2.8d, but what is the X=7d for? and in the next Horizontal line which is short, it declares .withPosition(5d, 3.2d)?? X=5d and X=7d gives such a big difference.
Q2:
Since i am using CategoryDateAxis, referring to InteractionWithAnnotationsFragment to draw a vertical line at a specific date/time, there is a short line vertical line on 3rd Dec with the code
sciChartBuilder.newVerticalLineAnnotation()
    .withX1(20).withY1(35d).withY2(33d)
    ...
Since its a date axis, i would expect it to accept a Date.class (or long in millis) instead of .withX1(20). It doesnt even make sense! How exactly do i create full height vertical line at a specific date/time?
- abc def asked 8 years ago
- last active 8 years ago
I have an application for which the VerticalLineAnnotation is a near perfect fit. However, to make it easier to add these annotations from the AnnotationCreatioinModifier, I would like to derive a new annotation class from VerticalLineAnnotation with a couple of new dependency properties, and new label style using these properties. Is this possible? I’ve looked through the forum and existing examples, and can’t find relevant examples. Can you point me in the right direction?
Bill
- William Lear asked 8 years ago
- last active 8 years ago
Hellow there,
I have this code for vertical lines of a graph binding to VM with INotifyPropertyChanged implemented.
<s:VerticalSlicseModifier.VerticalLines>
                                    <s:VerticalLineAnnotation  X1="{Binding IndexFirstBeep, UpdateSourceTrigger=PropertyChanged}"  >
                                    </s:VerticalLineAnnotation>
                                    <s:VerticalLineAnnotation  X1="{Binding IndexSecondBeep, UpdateSourceTrigger=PropertyChanged}"  >
                                    </s:VerticalLineAnnotation>
   </s:VerticalSliceModifier.VerticalLines>
At first I can see both vertical lines but after switching to another tab item and coming back, one (sometimes both) of the vertical lines disappears. If I double click the graph it reappears. This happens to almost all of my graphs. Here is how I set up my VM
private int indexFirstBeep = 6;
    public int IndexFirstBeep
    {
        get
        {
            return indexFirstBeep;
        }
        set
        {
            indexFirstBeep = value;
            OnPropertyChanged("IndexFirstBeep");
        }
    }
I have also noticed it happening to the renderables series of some of my graphs after switching their visibility.
Am on v4.0.30319
Please help.
- Kilosa Magali asked 8 years ago
- last active 8 years ago
I have both a VerticalLineAnnotation and LineAnnotation. When I drag my VerticalLineAnnotation around, the onAnnotationPositionChanged event is fired. The partial stack trace is attached. Once the Make Visible method is called, it goes through until it affects the LineAnnotation’s visiblity property that it has no direct binding too. If I change the visibility property that the LineAnnotation’s visibility is bound to, then moving the VerticalLineAnnotation changes that new property.
Why is this happening?
- Ryan Woods asked 8 years ago
- last active 8 years ago
Is there a way to find out what the Y value is where the VerticalLineAnnotation intersects the line chart that it is crossing over?
Edit: The attached image shows these intersections. I would like to know how I can get a hold of those y values.
- Ryan Woods asked 8 years ago
- last active 8 years ago
Hi,
is it possible to make the Touch Area of a SliceModifiers’ LineAnnotation bigger?
Right now the area has the same size as the MouseClick area, which is a bit too small if you want to drag a modifier with your finger.
Maybe I didn’t look hard enough, but I couldn’t find an overridable HitTest Method in VerticalSliceModifier/VerticalSliceModifierBase.
Or is it possible to override a HitTest (like the “IsPointWithinBounds()” method?) in the LineAnnotation class and use this custom VerticalLineAnnotation as my VerticalLine?
Thank you very much!
Regards,
dowe
- dowe asked 8 years ago
- last active 8 years ago
I want to display a point as a decimar separator in numeric values. I have achieved this in chart axis and vertical slices tooltips, creating a custom NumericLabelProvider (see attached picture). How can I do the same with vertical slices xacis labels? (in the picture attached, note that every numeric value has a point as a decimar separator, but vertical slice label has a comma). I have defined LabelTextFormatting of the slice with “#.##E+0”, but it doesn’t work.
Thanks in advance
Regads, Juan
- Jose Mora Almerich asked 8 years ago
- last active 8 years ago
Hi,
I am trying to customize the verticalLineAnnotation , kinda same as this question
all works as intended except I cant change the color of the point which is currently orange (see the photo). 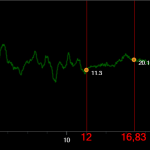 Would wish to have the orange dots transparent.
Would you please help.
Thank in advance.
MAGALI K.
- Kilosa Magali asked 9 years ago
- last active 9 years ago
Hello,
I am trying to get a right charting control for my boss , excuse me if am not using the right terms I am new to both WPF and SciCharts. Based on this example https://www.scichart.com/Abt.Controls.SciChart.SL.ExampleTestPage.html#/Abt.Controls.SciChart.Example;component/Examples/IWantTo/InspectDatapoints/SeriesVerticalSlicesExample.xaml , I am having the following difficulties:
-
Changing label background color of a VerticalLineAnnotation ( the one in blue lying below the X axis in the example)
I have been trying to figure out how to change the Vertical Slices’ labels background color (or make the label’s box transparent in order to see only the labels’ values and not the color around the label) but am not gettting a way out. -
Position the Curve – ‘Vertical slice’ intersection point y-axis value at the top end of the slice ( from the example, assuming i have only one curve say Curve A, the label ‘Curve A : 0.69’ shouldn’t appear right at the point of intersection between the curve and the slice but at the top end of the slice)
Would someone help please. Thank you in advance.
- Kilosa Magali asked 9 years ago
- last active 8 years ago
Hi,
I have a VerticalLineAnnotation that can be dragged over the chart by clicking and dragging on the line itself. (See attached image). The problem is, whenever I put the chart in front of a user, they try to drag by clicking on the label (the blue label with the time in the image).
How can I make this label draggable like the line?
Thanks.
- Robert Evans asked 9 years ago
- last active 9 years ago
I have a set of ChartModifiers on my SciChartSurface, carefully configured to work together like so:
<s:SciChartSurface.ChartModifier>
    <s:ModifierGroup>
        <s:LegendModifier x:Name="LegendModifier" />
        <s:ZoomPanModifier ExecuteOn="MouseRightButton" ClipModeX="None" />
        <s:RubberBandXyZoomModifier ExecuteOn="MouseLeftButton" />
        <s:SeriesSelectionModifier />
        <s:ZoomExtentsModifier ExecuteOn="MouseDoubleClick" />
        <s:MouseWheelZoomModifier />
    </s:ModifierGroup>
</s:SciChartSurface.ChartModifier>
I also have a pair of VerticalLineAnnotations, which I create in the C#. These are used to select points on the series that has been selected with the SeriesSelectionModifier.
The problem is that after the sliders are dragged, the mouse up event causes the selected series to be unselected. How can I prevent this from happening?
- Robert Evans asked 9 years ago
- last active 9 years ago
I am considering applying server-side licensing for my javerScript application.
In the document below, there is a phrase “Our server-side licensing component is written in C++.”
(https://support-dev.scichart.com/index.php?/Knowledgebase/Article/View/17256/42/)
However, there is only asp.net sample code on the provided github.
(https://github.com/ABTSoftware/SciChart.JS.Examples/tree/master/Sandbox/demo-dotnet-server-licensing)
I wonder if there is a sample code implemented in C++ for server-side licensing.
Can you provide c++ sample code?
Also, are there any examples to run on Ubuntu?
- Stuart McCullough asked 9 years ago
- last active 9 years ago
Is there any example of how to modify the intersection point template of where a verticallineannotation intersects say a fastlinerenderableseries?
The default is simply the value with a gray background.
In the “Series Vertical Slices” example I can see it includes the series name, but I don’t see anything in the “Source Code” that even asks for it.
Thanks for any help!
- dwoerner asked 9 years ago
- last active 9 years ago
How to create custom annotation which has BoxAnnotation with a VerticalLine Annotation at one end.
At present I’m achieving this by creating both annotations and synchronizing them in ChartModifier.
Look at the attached image where you can see two BoxAnnotations both having a VerticalLineAnnotation at one end. I’m disabling editing for BoxAnnotation and enabling editing only for VerticalLineAnnotation.
When VerticalLineAnnotation is dragged in X-Direction, I get the X1 value from it and manually set it to BoxAnnotations X2.
This is not good implementation. I can see lag between sync events. Is it possible to create a custom annotation which incorporates both Box and Vertical line annotations ? Or is it possible to set IsEditing for BoxAnnotations One End only ?
- Matthias Kientz asked 9 years ago
- last active 9 years ago
Hi, I’m trying to position vertical line annotations on a chart. I want to position them on a visible part of the chart, but I need to use the Absolute coordinate mode as I want the annotation to move with the data as the chart is panned or zoomed.
My question is then: how can I find the currently visible extents of the X axis? If the chart is zoomed or panned I need to know what the left and rightmost visible X-axis values are (independent of the data).
- Robert Evans asked 9 years ago
- last active 9 years ago
I can’t seem to directly set the font color of a VerticalLineAnnotation.
I found this link which shows how to set it directly, but that doesn’t seem to do anything either (is it broken again?)
Here is some of my code:
    <Style x:Key="sliceStyle" TargetType="s:VerticalLineAnnotation">
        <Setter Property="ShowLabel" Value="True"/>
        <Setter Property="Stroke" Value="#ff4"/>
        <Setter Property="IsEditable" Value="True"/>
        <Setter Property="Foreground" Value="#225"/>
        <Setter Property="LabelPlacement" Value="Axis"/>
        <Style.Triggers>
            <Trigger Property="IsSelected" Value="True">
                <Setter Property="Stroke" Value="Blue"/>
            </Trigger>
        </Style.Triggers>
    </Style>
                            <s:SciChartSurface.ChartModifier>
                            <s:ModifierGroup>
                                <s:VerticalSliceModifier Name="sliceModifier">
                                    <s:VerticalSliceModifier.VerticalLines>
                                        <s:VerticalLineAnnotation Style="{StaticResource sliceStyle}" X1="1" />
                                        <s:VerticalLineAnnotation  X1="3" Stroke="#ff4" IsEditable="True" LabelPlacement="Axis" ShowLabel="True" >
                                            <s:AnnotationLabel LabelPlacement="TopRight" Text="initially3" Foreground="Green"/>
                                        </s:VerticalLineAnnotation>
                                    </s:VerticalSliceModifier.VerticalLines>
                                </s:VerticalSliceModifier>
                            </s:ModifierGroup>
                        </s:SciChartSurface.ChartModifier>
Thanks for any insight!
- dwoerner asked 9 years ago
- last active 9 years ago
