Hi,
I need to make Radar to visualize position of some point. It is the picture like this
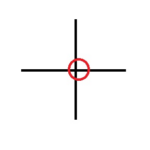
The coordinates of red circle center always changing and need to repaint it in real time. Can I realize something like that via SciChart?

- Fedor Iudin asked 5 months ago
 Hi Fedor, Thanks for your inquiry. Could you please provide us with more information regarding your requirements? E.g. what chart type are you using, is this 2D or 3D, etc. A picture or mockup showing the whole chart’s appearance would also be helpful. Thanks in advance, Lex S., SciChart Technical Support Engineer
 Hi, I need no more than I have on picture: just two axes and point (circle is better because it have better visibility) on 2D layout. In real process it helps user to check that coordinates of some process on industrial equipment placed around zero point
- Hi Fedor, Thank you for the clarification. I am going to discuss your inquiry with our team and will get back to you with an update shortly. Lex
- You must login to post comments
Hello.
Sorry for long answer but I waiting customer’s specification for this task. And now I have it.
As input data I will have X & Y – center coordinates and R – the radius of the circle. As you see I need to draw several circles. In real time all of them change all 3 parameters (X, Y, R). And I need to redraw all of them.

- Fedor Iudin answered 4 months ago
- last edited 4 months ago
- Hi Fedor, Thank you for the update. I’m forwarding the provided details to our developers and we’ll get back to you as soon as we have an update With best regards, Lex, SciChart Technical Support Engineer
- You must login to post comments
Hi Fedor,
We discussed your requirements and it looks that the best solution would be creating a custom RenderableSeries that would represent and draw a single/multiple circles. Please find more info about the CustomRenderableSeries API in our docs. Also, the article contains several examples.
General idea is to override the Draw(IRenderContext2D, IRenderPassData) method inside a CustomRenderableSeries derived class and call either the DrawEllipse(..) or DrawEllipses(..) method from the IRenderContext API to draw the circles.
You could use XyzDataSeries<> with AcceptsUnsortedData set to “True” as your data model. In this case, X and Y will represent corresponding coordinates and Z will represent the Radius. The XyzDataSeries can be updated via the Update(..) method.
Hope this helps!
Best Regards,
Joeri
- Joeri R answered 4 months ago
- You must login to post comments
Hi Fedor,
We discussed the provided details.
To achieve the shown Axis layout you can use the approach featured in our “Central XAxis and YAxis” example. Here is a link:
WPF Chart Central XAxis and YAxis – SciChart
More details can be found in the following documentation article:
SciChart WPF Documentation – Axis Alignment – Placing Axis Inside the Chart | WPF Chart Documentation
Regarding the circle, could you please tell how it’s planned to be set and which data format should be used? E.g. is the radius constant etc.
This will help us offer you the correct solution.
Thanks in advance,
Lex S., MSEE,
SciChart Technical Support Engineer
- Lex answered 5 months ago
- You must login to post comments
Please login first to submit.
