 <s:SciChartSurface x:Name="U_DataChart"
                    Grid.Row="0"
                    Margin="20"
                    s:ThemeManager.Theme="BrightSpark"
                    Background="{StaticResource BackColorBrush}"
                    BorderBrush="{Binding BorderColor}"
                    BorderThickness="{Binding BorderThinkness}"
                    MouseDoubleClick="U_DataChart_MouseDoubleClick"
                    MouseLeftButtonDown="U_DataChart_MouseLeftButtonDown"
                    Style="{StaticResource SciChartSurfaceStyle}">

     <s:SciChartSurface.XAxes>
         <s:NumericAxis x:Name="xAxis"
                        Margin="0,10,0,0"
                        Padding="0,0,0,0"
                        AxisTitle="{Binding XAxisTitle}"
                        DrawMajorBands="False"
                        DrawMajorGridLines="False"
                        DrawMajorTicks="False"
                        Id="WaveRange"
                        Style="{StaticResource AxisStyle}"
                        VisibleRangeLimitMode="MinMax">
             <s:NumericAxis.TickLabelStyle>
                 <Style TargetType="s:DefaultTickLabel">
                     <Setter Property="Foreground" Value="{StaticResource FontColorGrayBrush}" />
                     <Setter Property="FontSize" Value="25" />
                 </Style>
             </s:NumericAxis.TickLabelStyle>

             <s:NumericAxis.TitleStyle>
                 <Style TargetType="s:AxisTitle">
                     <Setter Property="Foreground" Value="{StaticResource FontColorGrayBrush}" />
                     <Setter Property="FontSize" Value="25" />
                 </Style>
             </s:NumericAxis.TitleStyle>
         </s:NumericAxis>
     </s:SciChartSurface.XAxes>

     <s:SciChartSurface.YAxes>
         <s:NumericAxis x:Name="yAxis"
                        Margin="0,0,0,0"
                        Padding="0,0,0,0"
                        AxisAlignment="Left"
                        AxisTitle="{Binding YAxisTitle}"
                        DrawMajorBands="False"
                        DrawMajorTicks="False"
                        Id="ValueRange"
                        Style="{StaticResource AxisStyle}"
                        VisibleRangeLimitMode="MinMax">
             <s:NumericAxis.TickLabelStyle>
                 <Style TargetType="s:DefaultTickLabel">
                     <Setter Property="Foreground" Value="{StaticResource FontColorGrayBrush}" />
                     <Setter Property="FontSize" Value="25" />
                 </Style>
             </s:NumericAxis.TickLabelStyle>
             <s:NumericAxis.TitleStyle>
                 <Style TargetType="s:AxisTitle">
                     <Setter Property="Foreground" Value="{StaticResource FontColorGrayBrush}" />
                     <Setter Property="FontSize" Value="25" />
                 </Style>
             </s:NumericAxis.TitleStyle>
         </s:NumericAxis>
     </s:SciChartSurface.YAxes>

     <s:SciChartSurface.ChartModifier>
         <s:ModifierGroup x:Name="U_ChartModifier" />
     </s:SciChartSurface.ChartModifier>
 </s:SciChartSurface>

 <!--<s:SciChartOverview Grid.Row="1"
                     Height="100"
                     Margin="20,0,20,10"
                     Padding="0,0,0,0"
                     s:ThemeManager.Theme="BrightSpark"
                     Background="{StaticResource BackColorBrush}"
                     BorderBrush="{Binding BorderColor}"
                     BorderThickness="1"
                     DataSeries="{Binding ElementName=m_view, Path=U_DataChart.RenderableSeries}"
                     ParentSurface="{Binding Source={x:Reference Name=U_DataChart}}"
                     SelectedRange="{Binding Source={x:Reference Name=U_DataChart}, Path=XAxis.VisibleRange, Mode=TwoWay}"
                     Visibility="{Binding OverViewVisibility}" />-->

 <!--  DataSeries="{Binding Source={x:Reference Name=U_DataChart}, Path=RenderableSeries}"  -->
 <s:SciChartSurface x:Name="OverviewSurface"
                    Grid.Row="1"
                    Height="100"
                    Margin="20,0,20,10"
                    Padding="0,0,0,0"
                    s:ThemeManager.Theme="BrightSpark"
                    Background="{StaticResource BackColorBrush}"
                    BorderBrush="{Binding BorderColor}"
                    BorderThickness="1"
                    Style="{StaticResource SciChartSurfaceStyle}"
                    Visibility="{Binding OverViewVisibility}">

     <!--<s:SciChartSurface.RenderableSeries>
         <s:FastLineRenderableSeries DataSeries="{Binding Path=Series}" />
     </s:SciChartSurface.RenderableSeries>-->

     <s:SciChartSurface.XAxis>
         <s:NumericAxis DrawMajorGridLines="False"
                        DrawMinorGridLines="False"
                        Style="{StaticResource AxisStyle}"
                        Visibility="Collapsed" />
     </s:SciChartSurface.XAxis>

     <s:SciChartSurface.YAxis>
         <s:NumericAxis DrawMajorGridLines="False"
                        DrawMinorGridLines="False"
                        Style="{StaticResource AxisStyle}"
                        Visibility="Collapsed" />
     </s:SciChartSurface.YAxis>
 </s:SciChartSurface>


 <s:SciChartScrollbar Grid.Row="1"
                      Height="100"
                      Margin="20,0,20,10"
                      Axis="{Binding Source={x:Reference Name=xAxis}}"
                      Background="Transparent"
                      BorderThickness="{Binding BorderThinkness}"
                      Visibility="{Binding OverViewVisibility}" />
Viewmodel.cs
public ObservableCollection<IRenderableSeries> Series
{
    get
    {
        return m_view.U_DataChart.RenderableSeries;
    }
    set
    {
        m_view.U_DataChart.RenderableSeries = value;
        OnPropertyChanged(nameof(Series));
    }
}

private void UpdateChartEvent(Point p_well, ObservableCollection<MeasureDataSt> p_data, PlateSetting p_ps)
{
    if (p_data.Count == 0)
    {
        this.SCIChartControlVM.ClearChart();
        return;
    }

    this.SCIChartControlVM.ClearChart();
    {
        ObservableCollection<(double, double)> tempData = new ObservableCollection<(double, double)>();
        foreach (MeasureDataSt sample in p_data)
            tempData.Add((sample.Wave, sample.Intensity));

        var Color = Application.Current.FindResource("ChartInitSeriesBrush") as Brush;
        var Series = SCIChartSeries.SetChartDataForScatterLine(tempData, this.SCIChartControlVM.GetXAxis, this.SCIChartControlVM.GetYAxis,
            ref this.SCIChartControlVM.FixedColorIndex, Color);
        this.SCIChartControlVM.Series.Add(Series);

        if (this.SCIChartControlVM.Series.LastOrDefault().DataSeries is XyDataSeries<double, double> data)
        {
            var AnnoColor = Application.Current.FindResource("ChartHZLineAnnotation") as Brush;
            this.SCIChartControlVM.AddHorizontalLineAnnotation(data.YValues.Max(), Brushes.White, AnnoColor, false, true);
        }
    }
    this.SCIChartControlVM.CalibrationChart();
}
I am manually adding series to the m_view.U_DataChart.RenderableSeries collection. I would like to directly bind m_view.U_DataChart.RenderableSeries to SciChartSurface (x:Name=”OverviewSurface”). I understand that using IRenderableSeriesViewModel for binding from the beginning would have been the correct approach, but it’s too late for major modifications at this point. Therefore, I have no choice but to pursue this method.
Is there a way to accomplish this?
- jeong younghoon asked 4 months ago
- You must login to post comments
Hi Jeong,
This can’t really be done like this. RenderableSeries are FrameworkElements and shouldn’t be declared in a ViewModel.
There are two ways to bind to RenderableSeries in SciChart WPF:
Method 1: declare RenderableSeries in XAML and bind to DataSeries in ViewModel
e.g.
<!-- where xmlns:s="http://schemas.abtsoftware.co.uk/scichart" -->
<s:SciChartSurface>

    <s:SciChartSurface.RenderableSeries>
        <s:FastLineRenderableSeries DataSeries="{Binding DataSeries}"
                                    StrokeThickness="1" StrokeDashArray="2 2"
                                    Stroke="OrangeRed"/>
    </s:SciChartSurface.RenderableSeries>

    <!--  XAxis, YAxis omitted for brevity  -->

</s:SciChartSurface>

// Viewmodel
class ViewModel
{
    public XyDataSeries DataSeries { get; set; }
}
With this method your number of RenderableSeries are fixed but you can modify the data from a view model.
Method 2: Declare RenderableSeriesViewModels in XAML and bind to SciChartSurface.RenderableSeries with the SeriesBinding Markup extension
e.g.
<!-- Declare a SciChartSurface with SeriesBinding -->
<!-- Where xmlns:s="http://schemas.abtsoftware.co.uk/scichart -->
<s:SciChartSurface RenderableSeries="{s:SeriesBinding RenderableSeriesViewModels}">

   <!-- XAxis, YAxis omitted for brevity -->

</s:SciChartSurface>

private ObservableCollection<IRenderableSeriesViewModel> _renderSeriesViewModels;
public ObservableCollection<IRenderableSeriesViewModel> RenderableSeriesViewModels
{
   get { return _renderSeriesViewModels; }
   set
   {
      _renderSeriesViewModels = value;
         OnPropertyChanged("RenderableSeriesViewModels");
   }
}
With this method you have full control over adding, removing renderable series as well as modifying the data from the view model.
- Andrew Burnett-Thompson answered 4 months ago
- You must login to post comments
The background pattern in the Overview can be removed by how?
- jeong younghoon answered 4 months ago
- last edited 4 months ago
 These are called Axis Bands. Try setting DrawMajorBands = false on the axis in the chart behind the SciChartScrollBar
- You must login to post comments
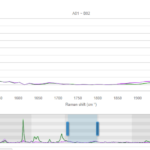
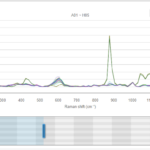
The result screen is missing so I am uploading it.
- jeong younghoon answered 4 months ago
- last edited 4 months ago
- You must login to post comments
Please login first to submit.


