The first question: Where did the example go (link below)?
https://support.scichart.com/support/solutions/articles/101000513349-tutorial-custom-legend-with-color-picker-and-custom-point-markers
I want to do like what and time ago I saved link but now this page is deleted. I need it because it is good example for resolve my 2nd question I think.
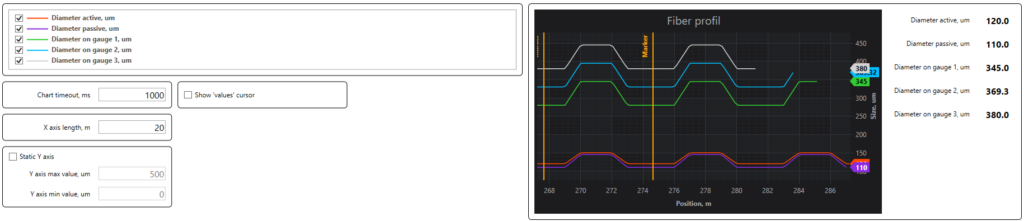
And the second question: I have chart
    <s:SciChartSurface Grid.Row="0" Grid.Column="0" x:Name="SciChartSurface" Margin="5" Padding="5"
                       ChartTitle="{mainVM:Localization MainChartSciChartSurface}" RenderableSeries="{s:SeriesBinding RenderableSeries}" Annotations="{s:AnnotationsBinding Annotations}">
        <s:SciChartSurface.XAxis>
            <s:NumericAxis AxisTitle="{mainVM:Localization XNumericAxis}" VisibleRange="{Binding VisibleRangeXAxis, Mode=TwoWay}" />
        </s:SciChartSurface.XAxis>
        <s:SciChartSurface.YAxis>
            <s:NumericAxis GrowBy="0.1,0.1"
                           AxisTitle="{mainVM:Localization YNumericAxis}" VisibleRange="{Binding VisibleRangeYAxis, Mode=TwoWay}" AutoRange="{Binding IsStaticYAxis, Converter={StaticResource StaticAxisToSciChartAutoRangeConverter}}" />
        </s:SciChartSurface.YAxis>
        <s:SciChartSurface.ChartModifier>
            <s:ModifierGroup>
                <s:SeriesValueModifier />
                <s:CursorModifier IsEnabled="{Binding IsShowValuesCursor}" />
                <s:LegendModifier x:Name="SciChartLegendModifier" GetLegendDataFor="AllSeries" ShowLegend="False"
                                  SeriesData="{Binding SeriesData, Mode=TwoWay}" />
            </s:ModifierGroup>
        </s:SciChartSurface.ChartModifier>
    </s:SciChartSurface>
Legend of chart placed in another panel
    <s:SciChartLegend x:Name="SciChartLegendControl" s:ThemeManager.Theme="Chrome" Margin="5,5" ScrollViewer.HorizontalScrollBarVisibility="Auto" ScrollViewer.VerticalScrollBarVisibility="Auto"
                      LegendData="{Binding SeriesData, Mode=OneWay}" ShowVisibilityCheckboxes="True" />
SeriesData is
private ChartDataObject _seriesData;
public ChartDataObject SeriesData
{
    get => _seriesData;
    set => SetProperty(ref _seriesData, value, nameof(SeriesData));
}
I want to see chart values in additional fields near the chart. I made this
<Grid>
    <Grid.ColumnDefinitions>
        <ColumnDefinition Width="Auto" />
    </Grid.ColumnDefinitions>
    <ListView Grid.Column="0" x:Name="ChartsListView" BorderBrush="Transparent" ItemContainerStyle="{StaticResource ListViewItemContainerDefaultStyle}"
              ItemsSource="{Binding SeriesData.SeriesInfo}">
        <ListView.ItemTemplate>
            <DataTemplate>
                <Grid>
                    <Grid.ColumnDefinitions>
                        <ColumnDefinition Width="*" />
                        <ColumnDefinition Width="Auto" />
                    </Grid.ColumnDefinitions>
                    <Label Grid.Column="0" Style="{StaticResource LabelDefaultStyle}"
                           Content="{Binding SeriesName}" Visibility="{Binding IsVisible, Converter={StaticResource BooleanToVisibilityConverter}}" />
                    <Label Grid.Column="1" Style="{StaticResource LabelIndicatorStyle}"
                           Content="{Binding YValue}" />
                </Grid>
            </DataTemplate>
        </ListView.ItemTemplate>
    </ListView>
</Grid>
All working correctly. But I want to bind Legend visibility checkboxes to my custom controls for values: when I uncheck chart checkbox control bound to this chart must becomes invisible. In code above I write
Visibility="{Binding IsVisible, Converter={StaticResource BooleanToVisibilityConverter}}"
but it not worked. How can I make it like I want?
And 3rd question: how can I guarantee the order of SeriesData lines? I have to be sure that charts in legend and custom controls ordered in the same ordering
- Fedor Iudin asked 4 months ago
- last active 3 months ago
I show very low values and they show me as 0.
Although they are not.
(I tried to change the
SciChartSurface.YAxis.NumericAxis.TextFormatting="0.000000000000000000000000000000000000000000...")
But it didn’t help
- ravid saadia asked 2 years ago
- last active 2 years ago
I want to build a Stacked Column Side by Side Chart by referring to the reference here.
My code:
export class OutputAmplitudeComponent implements OnInit, OnDestroy {

yValues:any;
x:any;

constructor(@Inject(SETTING_SERVICE) private settingService: SettingService, private cdr: ChangeDetectorRef) {}

ngOnInit() {
                this.settingService.registerSetting(OutputAmpSetting).pipe(takeUntil(this.ngUnsubAmplitudeData)).subscribe(setting => {
                    const OutputAmplitudeData = setting.value;

                    for (let x = 1; x < this.numberOfOutput; x++) {
                        if (this.OutputMode === 'Voltage') {
                            if (phaseNum === 1) {
                                this.ampSource.data[x-1].voltage1 = OutputAmplitudeData[x];
                            } else if (phaseNum === 2) {
                                this.ampSource.data[x-1].voltage2 = OutputAmplitudeData[x];
                            } else if (phaseNum === 3) {
                                this.ampSource.data[x-1].voltage3 = OutputAmplitudeData[x];
                            }
                        } else if (this.OutputMode === 'Current') {
                            if (phaseNum === 1) {
                                this.ampSource.data[x-1].current1 = OutputAmplitudeData[x];
                            } else if (phaseNum === 2) {
                                this.ampSource.data[x-1].current2 = OutputAmplitudeData[x];
                            } else if (phaseNum === 3) {
                                this.ampSource.data[x-1].current3 = OutputAmplitudeData[x];
                            }
                        }
        this.sciChartInit();
                    }
                });
            }

xValues = this.x;

phase1:number = parseFloat(this.ampSource.data[this.x-1].voltage1);
phase2:number = parseFloat(this.ampSource.data[this.x-1].voltage2);
phase3:number = parseFloat(this.ampSource.data[this.x-1].voltage3);

async sciChartInit() {

    const { wasmContext, sciChartSurface } = await SciChartSurface.create("chart");
    const xAxis = new NumericAxis(wasmContext);
    xAxis.labelProvider.numericFormat = ENumericFormat.Decimal_0;
    sciChartSurface.xAxes.add(xAxis);
    const yAxis = new NumericAxis(wasmContext);
    sciChartSurface.yAxes.add(yAxis);

    const dataSeries1 = new XyDataSeries(wasmContext, { xValues:this.x, yValues:this.phase1, dataSeriesName: "Phase 1" });
    const dataSeries2 = new XyDataSeries(wasmContext, { xValues:this.x, yValues:this.phase2, dataSeriesName: "Phase 2" });
    const dataSeries3 = new XyDataSeries(wasmContext, { xValues:this.x, yValues:this.phase3, dataSeriesName: "Phase 3" });

    const rendSeries1 = new StackedColumnRenderableSeries(wasmContext);
    rendSeries1.fill = "#dc443f";
    rendSeries1.stroke = "black";
    rendSeries1.strokeThickness = 1;
    rendSeries1.dataSeries = dataSeries1;
    rendSeries1.rolloverModifierProps.markerColor = "#b83735";
    rendSeries1.rolloverModifierProps.tooltipColor = "#dc443f";
    rendSeries1.rolloverModifierProps.tooltipTextColor = "#fff";
    rendSeries1.stackedGroupId = "one";

    const rendSeries2 = new StackedColumnRenderableSeries(wasmContext);
    rendSeries2.fill = "#aad34f";
    rendSeries2.stroke = "black";
    rendSeries2.strokeThickness = 1;
    rendSeries2.dataSeries = dataSeries2;
    rendSeries2.rolloverModifierProps.markerColor = "#87a73e";
    rendSeries2.rolloverModifierProps.tooltipColor = "#aad34f";
    rendSeries2.rolloverModifierProps.tooltipTextColor = "#000";
    rendSeries2.stackedGroupId = "two";

    const rendSeries3 = new StackedColumnRenderableSeries(wasmContext);
    rendSeries3.fill = "#8562b4";
    rendSeries3.stroke = "black";
    rendSeries3.strokeThickness = 1;
    rendSeries3.dataSeries = dataSeries3;
    rendSeries3.rolloverModifierProps.markerColor = "#715195";
    rendSeries3.rolloverModifierProps.tooltipColor = "#8562b4";
    rendSeries3.rolloverModifierProps.tooltipTextColor = "#fff";
    rendSeries3.stackedGroupId = "three";

    const verticallyStackedColumnCollection = new StackedColumnCollection(wasmContext);
    verticallyStackedColumnCollection.dataPointWidth = 0.5;
    verticallyStackedColumnCollection.add(rendSeries1, rendSeries2, rendSeries3);
    verticallyStackedColumnCollection.animation = new ScaleAnimation({ duration: 1000, fadeEffect: true });

    sciChartSurface.renderableSeries.add(verticallyStackedColumnCollection);

    sciChartSurface.chartModifiers.add(new ZoomExtentsModifier(), new ZoomPanModifier(), new MouseWheelZoomModifier());

    sciChartSurface.zoomExtents();

    sciChartSurface.chartModifiers.add(new RolloverModifier({ rolloverLineStroke: "#228B22" }));
    sciChartSurface.chartModifiers.add(
        new LegendModifier({
            placement: ELegendPlacement.TopRight,
            orientation: ELegendOrientation.Horizontal,
            showLegend: true,
            showCheckboxes: true,
            showSeriesMarkers: true
        })
    );
    return { wasmContext, sciChartSurface };
} }
.
Error:
ERROR in output-amplitude.component.ts: - error TS2322: Type 'number' is not assignable to type 'number[]'.
const dataSeries1 = new XyDataSeries(wasmContext, { xValues:this.x, yValues:this.phase1, dataSeriesName: "Phase 1" });
node_modules/scichart/Charting/Model/XyDataSeries.d.ts:
yValues?: number[];
The expected type comes from property 'yValues' which is declared here on type 'IXyDataSeriesOptions'
.
.
I tried to parse the variables to numbers by using parseFloat in phase1 to phase3 but it did not solve error in yValues.
Any idea on the solution?
- ETS Ong asked 3 years ago
- last active 3 years ago
