When I try to bind VisibleRange as a simple binding on the XAxis it works perfectly.
                <scichart:SciChartSurface.XAxis>
                    <scichart:NumericAxis AxisTitle="Tempo (s)"
                                          VisibleRange="{Binding XVisibleRange, Mode=TwoWay}"/>
                </scichart:SciChartSurface.XAxis>
But, in my case I have only one chart beeing displayed but two “RenderableSeries” in which only one of them is displayed, accordingly to the user selection. I use triggers for this and it works like a charm.
                <scichart:SciChartSurface.Resources>

                    <Style TargetType="{x:Type scichart:SciChartSurface}">
                        <Style.Triggers>
                            <DataTrigger Binding="{Binding ElementName=DAQ1_Selected, Path=IsChecked}" Value="true">
                                <Setter Property="RenderableSeries" Value="{scichart:SeriesBinding RenderableSeriesViewModels[0]}"/>
                            </DataTrigger>
                            <DataTrigger Binding="{Binding ElementName=DAQ1_Selected, Path=IsChecked}" Value="false">
                                <Setter Property="RenderableSeries" Value="{scichart:SeriesBinding RenderableSeriesViewModels[1]}"/>
                            </DataTrigger>
                        </Style.Triggers>
                    </Style>

                </scichart:SciChartSurface.Resources>
Now I’m trying to set the “VisibleRange” of each “RenderableSeries” with triggers but I cannot achieve that because there is no option to binding on the setter.
<scichart:SciChartSurface.XAxis>
                            <scichart:NumericAxis AxisTitle="Tempo (s)"
                                              GrowBy="0.01,0.01">

                                <Style TargetType="{x:Type scichart:NumericAxis}">
                                    <Style.Triggers>
                                        <DataTrigger Binding="{Binding ElementName=DAQ1_Selected, Path=IsChecked}" Value="true">
                                            <Setter Property="VisibleRange" Value="{scichart:AxesBinding XVisibleRange[0], Mode=TwoWay}" />
                                        </DataTrigger>
                                        <DataTrigger Binding="{Binding ElementName=DAQ1_Selected, Path=IsChecked}" Value="false">
                                            <Setter Property="VisibleRange" Value="{scichart:AxesBinding XVisibleRange[1], Mode=TwoWay}" />
                                        </DataTrigger>
                                    </Style.Triggers>
                                </Style>

                            </scichart:NumericAxis>
                        </scichart:SciChartSurface.XAxis>
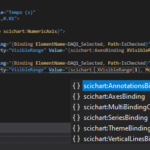
On the “value” of Setter I have only the following options:
- AnnotationsBinding AxisBindingBinding MultiBindingCompatible
SeriesBinding ThemeBinding VerticalLinesBinding
My question is:
Is there a way to binding “VisibleRange” on “Style.Triggers”?
Thank you,
Eduardo Arruda
- Eduardo Arruda asked 2 years ago
- You must login to post comments
Hi Eduardo
I’m not sure what you’re trying to do here but this part of the code looks wrong:
<DataTrigger Binding="{Binding ElementName=DAQ1_Selected, Path=IsChecked}" Value="true">
                            <Setter Property="RenderableSeries" Value="{scichart:SeriesBinding RenderableSeriesViewModels[0]}"/>
</DataTrigger>
The SeriesBinding Markup Extension generates a new list of RenderableSeries from RenderableSeriesViewModels, and binds the view model to it.
If you call this in a trigger you are getting a new list each time. It won’t be the same list as the ones on the SciChartSurface. This might explain the wrong behaviour you are seeing.
What are you trying to achieve and why? Perhaps there is another way to achieve the same thing.
Best regards,
Andrew
- Andrew Burnett-Thompson answered 2 years ago
- You must login to post comments
Please login first to submit.

