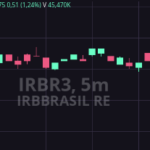
Hi, im facing a problem related to VisibleRange Auto,
when a value is much higher than the values
already plotted and I try to scroll along the X axis,
the value on the Y axis does not fully show the candle.
Please see the attached images.
As you can see, the biggest value of my last candle is 41.75, however,
the numberRange that is being used in VisibleRange Auto is 41.63.
Is there any way around this?
- rocket trade asked 2 months ago
 First up, you absolutely should update to v3.3.560 or greater (see the release note for why https://www.scichart.com/scichart-js-v3-3-released/). Secondly, can you reproduce this by modifying this example? https://codepen.io/scichart/pen/abQOqQE Your specific dataset may reveal a bug, or, there may by another problem in the setup of the chart
 I notice you have a volume profile here, which means you are probably syncing the y range of your candle’s axis with the x range of your volume’s axis. Depending which way round you do this, you can end up with weird behaviour where autorange will override your axis sync. This demo https://demo.scichart.com/javascript-dragabble-event-markers deals with some of the same issues and shows how you can configure modifiers to ignore certain axes.
- You must login to post comments
Please login first to submit.


