SciChart® the market leader in Fast WPF Charts, WPF 3D Charts, and iOS Chart & Android Chart Components
SciChart WPF ships with hundreds of WPF Chart Examples which you can browse, play with, view the source-code and even export each WPF Chart Example to a stand-alone Visual Studio solution. All of this is possible with the new and improved SciChart WPF Examples Suite, which ships as part of the SciChart WPF SDK.
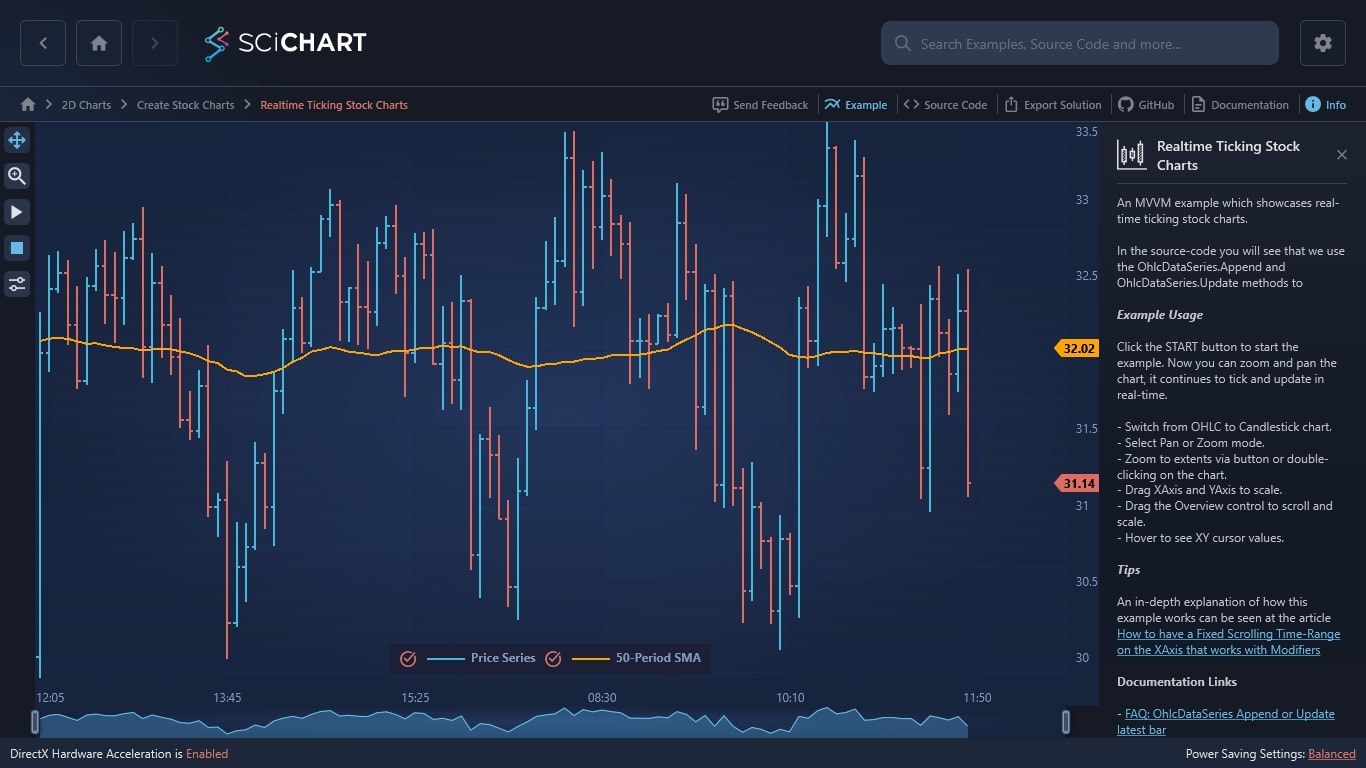
An MVVM example which showcases real-time ticking stock charts.
In the source-code you will see that we use the OhlcDataSeries.Append and OhlcDataSeries.Update methods to update a stock chart in realtime. SciChart is very fast and suitable for realtime markets and demanding trading applications. In this example we also demonstrate how to scroll the chart so that the latest prices always appear in view, unless the user drags back to see older prices.
Example Usage
Click the START button to start the example. Now you can zoom and pan the chart, it continues to tick and update in real-time.
Documentation Links
The C#/WPF source code for the WPF Realtime Ticking Stock Charts example is included below (Scroll down!).
Did you know you can also view the source code from one of the following sources as well?
<UserControl x:Class="SciChart.Examples.Examples.CreateStockCharts.RealtimeMvvm.CreateRealTimeTickingStockChart" xmlns="http://schemas.microsoft.com/winfx/2006/xaml/presentation" xmlns:x="http://schemas.microsoft.com/winfx/2006/xaml" xmlns:d="http://schemas.microsoft.com/expression/blend/2008" xmlns:ext="http://schemas.abtsoftware.co.uk/scichart/exampleExternals" xmlns:i="http://schemas.microsoft.com/expression/2010/interactivity" xmlns:mc="http://schemas.openxmlformats.org/markup-compatibility/2006" xmlns:s="http://schemas.abtsoftware.co.uk/scichart" d:DesignHeight="400" d:DesignWidth="600" mc:Ignorable="d"> <UserControl.Resources> <ext:DoubleToGridLengthConverter x:Key="DoubleToGridLengthConverter" /> <Style x:Key="LegendStyle" TargetType="s:LegendModifier"> <Setter Property="Margin" Value="5" /> <Setter Property="LegendPlacement" Value="Inside" /> <Setter Property="HorizontalAlignment" Value="Center" /> <Setter Property="VerticalAlignment" Value="Bottom" /> <Setter Property="Orientation" Value="Horizontal" /> <Setter Property="ShowSeriesMarkers" Value="True" /> <Setter Property="ShowVisibilityCheckboxes" Value="True" /> </Style> </UserControl.Resources> <Grid> <Grid.ColumnDefinitions> <ColumnDefinition Width="Auto" /> <ColumnDefinition Width="*" /> </Grid.ColumnDefinitions> <Grid.RowDefinitions> <RowDefinition Height="*" /> <RowDefinition Height="Auto" /> </Grid.RowDefinitions> <Border Background="#FF232426" BorderBrush="#323539" BorderThickness="0,0,2,0" Canvas.ZIndex="9999"> <StackPanel Orientation="Vertical"> <ToggleButton x:Name="IsZoomEnabled" Style="{StaticResource ZoomButtonStyle}" ToolTipService.ToolTip="Toggle Rubber-Band Zoom" s:ToggleButtonExtensions.GroupName="RealtimeTickingStockChart_Modifiers" /> <ToggleButton x:Name="IsPanEnabled" IsChecked="True" Style="{StaticResource PanButtonStyle}" ToolTipService.ToolTip="Toggle Zoom-Pan" s:ToggleButtonExtensions.GroupName="RealtimeTickingStockChart_Modifiers" /> <ext:FlyoutSeparator /> <ToggleButton Command="{Binding StartUpdatesCommand}" Padding="4" Style="{StaticResource PlayButtonStyle}" s:ToggleButtonExtensions.GroupName="RealtimeTickingStockChart_StartStop" /> <ToggleButton Command="{Binding StopUpdatesCommand}" Padding="4" Style="{StaticResource PauseButtonStyle}" s:ToggleButtonExtensions.GroupName="RealtimeTickingStockChart_StartStop" /> <ext:FlyoutSeparator /> <ext:FlyoutMenuButton Content="CTRL" Padding="0" Style="{StaticResource FlyoutMenuButtonStyle}"> <ext:FlyoutMenuButton.PopupContent> <StackPanel MinWidth="150" Orientation="Vertical"> <TextBlock Text="RenderableSeries Controls" /> <ext:FlyoutSeparator /> <TextBlock Text="Stroke Thickness:" /> <ComboBox x:Name="StrokeThicknesses" Margin="4" ItemsSource="{Binding StrokeThicknesses}" SelectedIndex="1" /> <TextBlock Text="Series Styles:" /> <ComboBox Margin="4" ItemsSource="{Binding SeriesStyles}" SelectedItem="{Binding SelectedSeriesStyle, Mode=TwoWay}" /> <CheckBox x:Name="UseAntiAliasing" Margin="4" Content="Use Antialiasing?" IsChecked="False" /> </StackPanel> </ext:FlyoutMenuButton.PopupContent> </ext:FlyoutMenuButton> </StackPanel> </Border> <!-- Define the StockChart control, binding to PriceData --> <s:SciStockChart x:Name="PriceChart" Grid.Column="1" IsPanEnabled="{Binding Source={x:Reference Name=IsPanEnabled}, Path=IsChecked, Mode=TwoWay}" IsRubberBandZoomEnabled="{Binding Source={x:Reference Name=IsZoomEnabled}, Path=IsChecked, Mode=TwoWay}" LegendStyle="{StaticResource LegendStyle}" RenderableSeries="{s:SeriesBinding SeriesViewModels}"> <s:SciStockChart.Resources> <Style x:Key="BaseRenderableSeriesStyle" TargetType="s:BaseRenderableSeries"> <Setter Property="AntiAliasing" Value="{Binding Source={x:Reference Name=UseAntiAliasing}, Path=IsChecked}" /> <Setter Property="StrokeThickness" Value="{Binding Source={x:Reference Name=StrokeThicknesses}, Path=SelectedItem}" /> </Style> <Style x:Key="LineStyle" TargetType="s:FastLineRenderableSeries"> <Setter Property="Stroke" Value="#ffffa500" /> <Setter Property="AntiAliasing" Value="{Binding Source={x:Reference Name=UseAntiAliasing}, Path=IsChecked}" /> <Setter Property="StrokeThickness" Value="{Binding Source={x:Reference Name=StrokeThicknesses}, Path=SelectedItem}" /> </Style> </s:SciStockChart.Resources> <!-- Override any properties of the built-in CategoryDateTimeAxis --> <s:SciStockChart.XAxisStyle> <Style TargetType="s:CategoryDateTimeAxis"> <Setter Property="BarTimeFrame" Value="{Binding BarTimeFrame, Mode=OneWay}" /> <Setter Property="DrawMinorGridLines" Value="False" /> <Setter Property="DrawMajorBands" Value="True" /> <Setter Property="VisibleRange" Value="{Binding XVisibleRange, Mode=TwoWay}" /> <Setter Property="GrowBy" Value="0, 0.1" /> </Style> </s:SciStockChart.XAxisStyle> <!-- Override any properties of the built-in NumericAxis --> <s:SciStockChart.YAxisStyle> <Style TargetType="s:NumericAxis"> <Setter Property="AutoRange" Value="Always" /> </Style> </s:SciStockChart.YAxisStyle> </s:SciStockChart> <!-- This grid is used to space Overview Control so its width matches parent chart XAxis --> <Grid Grid.Row="1" Grid.Column="1" Height="32"> <!-- The grid is used to set paddings around the Overview, so that the size of the Overview matches the size of the XAxis on the parent chart --> <Grid.ColumnDefinitions> <ColumnDefinition Width="20" /> <!-- Matches parent surface padding left --> <ColumnDefinition Width="*" /> <!-- Hosts overview control --> <ColumnDefinition Width="{Binding Source={x:Reference Name=Proxy}, Path=ActualWidthValue, Mode=OneWay, Converter={StaticResource DoubleToGridLengthConverter}}" /> <!-- Used to bind to parent surface YAxis --> <ColumnDefinition Width="15" /> <!-- Matches parent surface padding right --> </Grid.ColumnDefinitions> <ext:ActualSizePropertyProxy x:Name="Proxy" Element="{Binding Source={x:Reference Name=PriceChart}, Path=YAxis}" /> <!-- Define the Overview control, binding to XVisibleRange, which is shared between this and the SciStockChart control --> <s:SciChartOverview Grid.Column="1" ParentSurface="{Binding Source={x:Reference Name=PriceChart}, Mode=OneWay}" SelectedRange="{Binding XVisibleRange, Mode=TwoWay}" s:ThemeManager.Theme="{Binding ElementName=ThemeCombo, Path=SelectedItem}" /> </Grid> </Grid> <!-- Used for the example only. On user switching example, stop the timer --> <!-- You shouldnt need this for your code --> <i:Interaction.Triggers> <i:EventTrigger EventName="Unloaded"> <i:InvokeCommandAction Command="{Binding StopUpdatesCommand}" /> </i:EventTrigger> </i:Interaction.Triggers> </UserControl>
// ************************************************************************************* // SCICHART® Copyright SciChart Ltd. 2011-2018. All rights reserved. // // Web: http://www.scichart.com // Support: support@scichart.com // Sales: sales@scichart.com // // CreateRealTimeTickingStockChart.xaml.cs is part of the SCICHART® Examples. Permission is hereby granted // to modify, create derivative works, distribute and publish any part of this source // code whether for commercial, private or personal use. // // The SCICHART® examples are distributed in the hope that they will be useful, but // without any warranty. It is provided "AS IS" without warranty of any kind, either // expressed or implied. // ************************************************************************************* using System.Windows.Controls; namespace SciChart.Examples.Examples.CreateStockCharts.RealtimeMvvm { public partial class CreateRealTimeTickingStockChart : UserControl { public CreateRealTimeTickingStockChart() { InitializeComponent(); } } }
// ************************************************************************************* // SCICHART® Copyright SciChart Ltd. 2011-2018. All rights reserved. // // Web: http://www.scichart.com // Support: support@scichart.com // Sales: sales@scichart.com // // CreateRealTimeTickingStockChartViewModel.cs is part of the SCICHART® Examples. Permission is hereby granted // to modify, create derivative works, distribute and publish any part of this source // code whether for commercial, private or personal use. // // The SCICHART® examples are distributed in the hope that they will be useful, but // without any warranty. It is provided "AS IS" without warranty of any kind, either // expressed or implied. // ************************************************************************************* using System; using System.Collections.Generic; using System.Collections.ObjectModel; using System.Linq; using System.Windows.Input; using SciChart.Charting.Common.Helpers; using SciChart.Charting.Model.ChartSeries; using SciChart.Charting.Model.DataSeries; using SciChart.Data.Model; using SciChart.Examples.ExternalDependencies.Common; using SciChart.Examples.ExternalDependencies.Data; namespace SciChart.Examples.Examples.CreateStockCharts.RealtimeMvvm { public class CreateRealTimeTickingStockChartViewModel : BaseViewModel { private readonly IMarketDataService _marketDataService; private readonly MovingAverage _sma50 = new MovingAverage(50); private readonly double _barTimeFrame = TimeSpan.FromMinutes(5).TotalSeconds; private PriceBar _lastPrice; private IndexRange _xVisibleRange; private string _selectedSeriesStyle; private ObservableCollection<IRenderableSeriesViewModel> _seriesViewModels; public CreateRealTimeTickingStockChartViewModel() { _seriesViewModels = new ObservableCollection<IRenderableSeriesViewModel>(); // Market data service simulates live ticks. We want to load the chart with 150 historical bars // then later do real-time ticking as new data comes in _marketDataService = new MarketDataService(new DateTime(2000, 08, 01, 12, 00, 00), 5, 20); // Add ChartSeriesViewModels for the candlestick and SMA series var ds0 = new OhlcDataSeries<DateTime, double> { SeriesName = "Price Series"}; _seriesViewModels.Add(new OhlcRenderableSeriesViewModel { DataSeries = ds0, StyleKey = "BaseRenderableSeriesStyle" }); var ds1 = new XyDataSeries<DateTime, double> {SeriesName = "50-Period SMA"}; _seriesViewModels.Add(new LineRenderableSeriesViewModel {DataSeries = ds1, StyleKey = "LineStyle"}); // Append 150 historical bars to data series var prices = _marketDataService.GetHistoricalData(100); ds0.Append( prices.Select(x => x.DateTime), prices.Select(x => x.Open), prices.Select(x => x.High), prices.Select(x => x.Low), prices.Select(x => x.Close)); ds1.Append(prices.Select(x => x.DateTime), prices.Select(y => _sma50.Push(y.Close).Current)); SelectedSeriesStyle = "Ohlc"; } public ObservableCollection<IRenderableSeriesViewModel> SeriesViewModels { get { return _seriesViewModels; } set { _seriesViewModels = value; OnPropertyChanged("SeriesViewModels"); } } public double BarTimeFrame { get { return _barTimeFrame; } } public ICommand TickCommand { get { return new ActionCommand(() => OnNewPrice(_marketDataService.GetNextBar())); } } public ICommand StartUpdatesCommand { get { return new ActionCommand(() => _marketDataService.SubscribePriceUpdate(OnNewPrice)); } } public ICommand StopUpdatesCommand { get { return new ActionCommand(() => _marketDataService.ClearSubscriptions()); } } public IEnumerable<string> SeriesStyles { get { return new[] {"OHLC", "Candle", "Line", "Mountain"}; } } public IEnumerable<int> StrokeThicknesses { get { return new[] {1, 2, 3, 4, 5}; }} public string SelectedSeriesStyle { get { return _selectedSeriesStyle; } set { _selectedSeriesStyle = value; OnPropertyChanged("SelectedSeriesStyle"); if (_selectedSeriesStyle == "OHLC") { SeriesViewModels[0] = new OhlcRenderableSeriesViewModel { DataSeries = SeriesViewModels[0].DataSeries, StyleKey = "BaseRenderableSeriesStyle" }; } else if (_selectedSeriesStyle == "Candle") { SeriesViewModels[0] = new CandlestickRenderableSeriesViewModel { DataSeries = SeriesViewModels[0].DataSeries, StyleKey = "BaseRenderableSeriesStyle" }; } else if (_selectedSeriesStyle == "Line") { SeriesViewModels[0] = new LineRenderableSeriesViewModel { DataSeries = SeriesViewModels[0].DataSeries, StyleKey = "BaseRenderableSeriesStyle" }; } else if (_selectedSeriesStyle == "Mountain") { SeriesViewModels[0] = new MountainRenderableSeriesViewModel { DataSeries = SeriesViewModels[0].DataSeries, StyleKey = "BaseRenderableSeriesStyle" }; } } } public IndexRange XVisibleRange { get { return _xVisibleRange; } set { if (Equals(_xVisibleRange, value)) return; _xVisibleRange = value; OnPropertyChanged("XVisibleRange"); } } private void OnNewPrice(PriceBar price) { // Ensure only one update processed at a time from multi-threaded timer lock (this) { // Update the last price, or append? var ds0 = (IOhlcDataSeries<DateTime, double>) _seriesViewModels[0].DataSeries; var ds1 = (IXyDataSeries<DateTime, double>) _seriesViewModels[1].DataSeries; if (_lastPrice != null && _lastPrice.DateTime == price.DateTime) { ds0.Update(price.DateTime, price.Open, price.High, price.Low, price.Close); ds1.Update(price.DateTime, _sma50.Update(price.Close).Current); } else { ds0.Append(price.DateTime, price.Open, price.High, price.Low, price.Close); ds1.Append(price.DateTime, _sma50.Push(price.Close).Current); // If the latest appending point is inside the viewport (i.e. not off the edge of the screen) // then scroll the viewport 1 bar, to keep the latest bar at the same place if (XVisibleRange.Max > ds0.Count) { var existingRange = _xVisibleRange; var newRange = new IndexRange(existingRange.Min + 1, existingRange.Max + 1); XVisibleRange = newRange; } } _lastPrice = price; } } } }