SciChart.js JavaScript 2D Charts API > ChartModifier API > Miscellaneous Modifiers > Legend Modifier
Legend Modifier

SciChart.js features a rich, customisable legend API which is based on our powerful ChartModifier API. To add a Legend to a chart use LegendModifier.

SciChart legends support the following:

  • Placement of the Legend inside the chart top-left, top-right, bottom-left or bottom-right aligned
  • Horizontal or Vertical orientation of the Legend
  • Showing data series name, line color/marker, visibility checkboxes
  • Allowing full customization of the Legend using auto-generated classes scichart__legendscichart__legend-item
  • Placing the Legend anywhere outside the chart

Showing a Legend

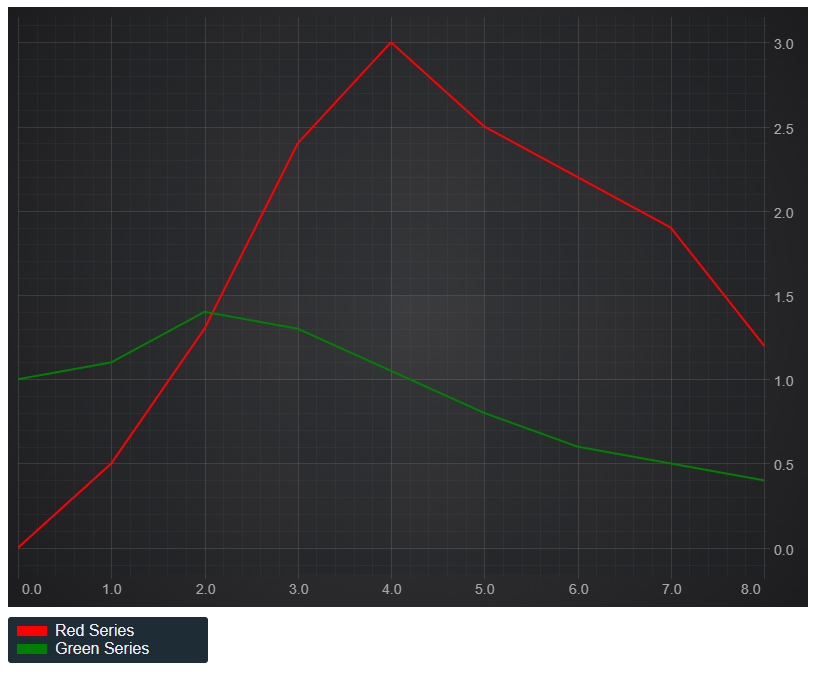
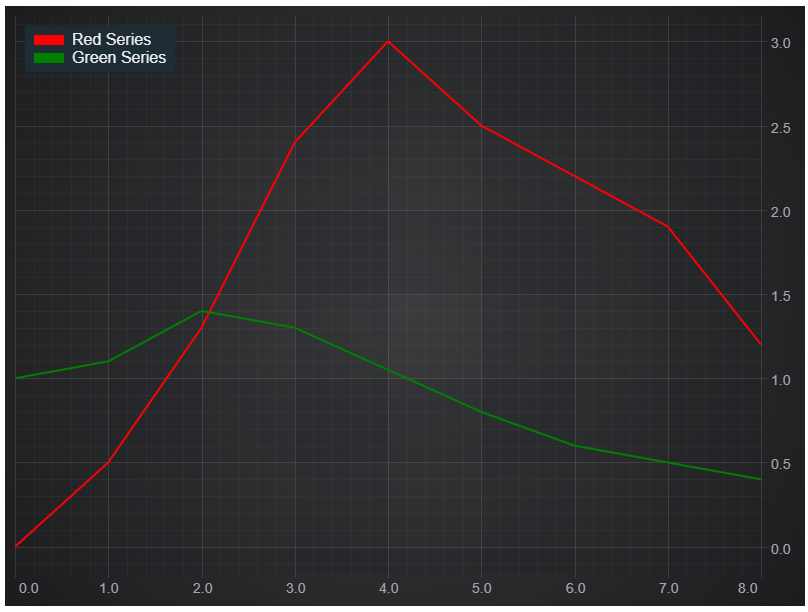
In order to show a legend add the LegendModifier to the chart.

sciChartSurface.chartModifiers.add(new LegendModifier());

 The full example code you will find below.

import { SciChartSurface } from 'scichart/Charting/Visuals/SciChartSurface';
import { NumericAxis } from 'scichart/Charting/Visuals/Axis/NumericAxis';
import { FastLineRenderableSeries } from 'scichart/Charting/Visuals/RenderableSeries/FastLineRenderableSeries';
import { XyDataSeries } from 'scichart/Charting/Model/XyDataSeries';
import { NumberRange } from 'scichart/Core/NumberRange';
import { LegendModifier } from 'scichart/Charting/ChartModifiers/LegendModifier';
export async function legendModifierJs(divId) {
    const { sciChartSurface, wasmContext } = await SciChartSurface.create(divId);
    sciChartSurface.xAxes.add(new NumericAxis(wasmContext));
    sciChartSurface.yAxes.add(new NumericAxis(wasmContext, { growBy: new NumberRange(0.05, 0.05) }));
    const xLineValues = [0, 1, 2, 3, 4, 5, 6, 7, 8];
    const yLine1Values = [0, 0.5, 1.3, 2.4, 3, 2.5, 2.2, 1.9, 1.2];
    const yLine2Values = [1, 1.1, 1.4, 1.3, 1.05, 0.8, 0.6, 0.5, 0.4];
    sciChartSurface.renderableSeries.add(new FastLineRenderableSeries(wasmContext, {
        stroke: 'red',
        strokeThickness: 3,
        dataSeries: new XyDataSeries(wasmContext, {
            dataSeriesName: 'Red Series',
            xValues: xLineValues,
            yValues: yLine1Values
        })
    }));
    sciChartSurface.renderableSeries.add(new FastLineRenderableSeries(wasmContext, {
        stroke: 'green',
        strokeThickness: 3,
        dataSeries: new XyDataSeries(wasmContext, {
            dataSeriesName: 'Green Series',
            xValues: xLineValues,
            yValues: yLine2Values
        })
    }));
    // Show the legend by adding a LegendModifier to the SciChartSurface.chartModifiers collection
    sciChartSurface.chartModifiers.add(new LegendModifier({
        showCheckboxes: false,
        showSeriesMarkers: true,
        showLegend: true,
    }));
}
import { SciChartSurface } from 'scichart/Charting/Visuals/SciChartSurface';
import { NumericAxis } from 'scichart/Charting/Visuals/Axis/NumericAxis';
import { FastLineRenderableSeries } from 'scichart/Charting/Visuals/RenderableSeries/FastLineRenderableSeries';
import { XyDataSeries } from 'scichart/Charting/Model/XyDataSeries';
import { NumberRange } from 'scichart/Core/NumberRange';
import { LegendModifier } from 'scichart/Charting/ChartModifiers/LegendModifier';
export async function legendModifierTs(divId: string) {
    const { sciChartSurface, wasmContext } = await SciChartSurface.create(divId);
    sciChartSurface.xAxes.add(new NumericAxis(wasmContext));
    sciChartSurface.yAxes.add(new NumericAxis(wasmContext, { growBy: new NumberRange(0.05, 0.05) }));
    const xLineValues = [0, 1, 2, 3, 4, 5, 6, 7, 8];
    const yLine1Values = [0, 0.5, 1.3, 2.4, 3, 2.5, 2.2, 1.9, 1.2];
    const yLine2Values = [1, 1.1, 1.4, 1.3, 1.05, 0.8, 0.6, 0.5, 0.4];
    sciChartSurface.renderableSeries.add(new FastLineRenderableSeries(wasmContext, {
        stroke: 'red',
        strokeThickness: 3,
        dataSeries: new XyDataSeries(wasmContext, {
            dataSeriesName: 'Red Series',
            xValues: xLineValues,
            yValues: yLine1Values
        })
    }));
    sciChartSurface.renderableSeries.add(new FastLineRenderableSeries(wasmContext, {
        stroke: 'green',
        strokeThickness: 3,
        dataSeries: new XyDataSeries(wasmContext, {
            dataSeriesName: 'Green Series',
            xValues: xLineValues,
            yValues: yLine2Values
        })
    }));
    // Show the legend by adding a LegendModifier to the SciChartSurface.chartModifiers collection
    sciChartSurface.chartModifiers.add(new LegendModifier({
        showCheckboxes: false,
        showSeriesMarkers: true,
        showLegend: true,
    }));
}

 This gives us the line chart with the legend placed in the left top corner.

Showing visibility checkboxes

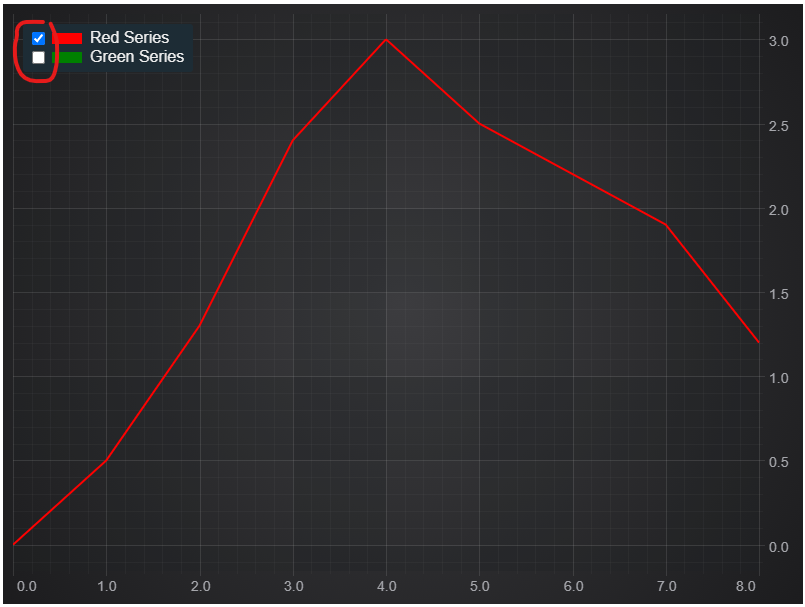
In order to show visibility checkboxes pass showCheckboxes option into the LegendModifier constructor.

sciChartSurface.chartModifiers.add(new LegendModifier({ showCheckboxes: true }));

This will draw the legend with checkboxes.

Now check/uncheck the checkboxes to show/hide renderable series. 


Note: the Checkbox is bound to BaseRenderableSeries.isVisible. You can subscribe to BaseRenderableSeries.isVisibleChanged by following steps in this documentation page.

Subscribing to Checkbox Checked Changed

As well as subscribing to BaseRenderableSeries.isVisibleChanged, you can now subscribe to LegendModifier.isCheckedChanged event. This can be done either in the constructor options to LegendModifier or after creation.

const legend = new LegendModifier({
    showCheckboxes: true,
    showSeriesMarkers: true,
    showLegend: true,
    // Subscribe to checked changed here
    isCheckedChangedCallback: (series, isChecked) => {
        console.log(`Option 1: Legend item ${series.type} isChecked=${isChecked}`);   
    }
});
// Or here after instantiation
legend.isCheckedChanged.subscribe((args) => {
    console.log(`Option 2: Legend item ${args.series.type} isChecked=${args.isChecked}`);
});
// Add the legend to the chart
sciChartSurface.chartModifiers.add(legend);
const legend = new LegendModifier({
    showCheckboxes: true,
    showSeriesMarkers: true,
    showLegend: true,
    // Subscribe to checked changed here
    isCheckedChangedCallback: (series: IRenderableSeries, isChecked: boolean) => {
        console.log(`Option 1: Legend item ${series.type} isChecked=${isChecked}`);   
    }
});
// Or here after instantiation
legend.isCheckedChanged.subscribe((args: TCheckedChangedArgs) => {
    console.log(`Option 2: Legend item ${args.series.type} isChecked=${args.isChecked}`);
});
// Add the legend to the chart
sciChartSurface.chartModifiers.add(legend);

Placing the Legend outside the chart

It is possible to place the Legend anywhere on the HTML page. In order to do that create a div element with some Id, the Id will be used to find this div element and to append the Legend. When creating the Legend pass placementDivId property into the constructor.

sciChartSurface.chartModifiers.add(new LegendModifier({ placementDivId: "legend-div-id" }));

The full example code.

HTML
Copy Code
<div style="padding: 20px;">
    <p>Legend Modifier Example</p>
    <div id="scichart-div-id"  style="width: 800px; height: 600px;"></div>
    <div id="legend-div-id" style="margin-top: 10px; width: 200px;"></div>
</div>
import { SciChartSurface } from 'scichart/Charting/Visuals/SciChartSurface';
import { NumericAxis } from 'scichart/Charting/Visuals/Axis/NumericAxis';
import { FastLineRenderableSeries } from 'scichart/Charting/Visuals/RenderableSeries/FastLineRenderableSeries';
import { XyDataSeries } from 'scichart/Charting/Model/XyDataSeries';
import { NumberRange } from 'scichart/Core/NumberRange';
import { LegendModifier } from 'scichart/Charting/ChartModifiers/LegendModifier';
export async function legendModifierTs(divId) {
    const { sciChartSurface, wasmContext } = await SciChartSurface.create(divId);
    sciChartSurface.xAxes.add(new NumericAxis(wasmContext));
    sciChartSurface.yAxes.add(new NumericAxis(wasmContext, { growBy: new NumberRange(0.05, 0.05) }));
    const xLineValues = [0, 1, 2, 3, 4, 5, 6, 7, 8];
    const yLine1Values = [0, 0.5, 1.3, 2.4, 3, 2.5, 2.2, 1.9, 1.2];
    const yLine2Values = [1, 1.1, 1.4, 1.3, 1.05, 0.8, 0.6, 0.5, 0.4];
    const lineSeries1 = new FastLineRenderableSeries(wasmContext, {
        stroke: 'red',
        strokeThickness: 3,
        dataSeries: new XyDataSeries(wasmContext, {
            dataSeriesName: 'Red Series',
            xValues: xLineValues,
            yValues: yLine1Values
        })
    });
    sciChartSurface.renderableSeries.add(lineSeries1);
    const lineSeries2 = new FastLineRenderableSeries(wasmContext, {
        stroke: 'green',
        strokeThickness: 3,
        dataSeries: new XyDataSeries(wasmContext, {
            dataSeriesName: 'Green Series',
            xValues: xLineValues,
            yValues: yLine2Values
        })
    });
    sciChartSurface.renderableSeries.add(lineSeries2);
    // External placement
    sciChartSurface.chartModifiers.add(new LegendModifier({ placementDivId: "legend-div-id" }));
}
import { SciChartSurface } from 'scichart/Charting/Visuals/SciChartSurface';
import { NumericAxis } from 'scichart/Charting/Visuals/Axis/NumericAxis';
import { FastLineRenderableSeries } from 'scichart/Charting/Visuals/RenderableSeries/FastLineRenderableSeries';
import { XyDataSeries } from 'scichart/Charting/Model/XyDataSeries';
import { NumberRange } from 'scichart/Core/NumberRange';
import { LegendModifier } from 'scichart/Charting/ChartModifiers/LegendModifier';
export async function legendModifierTs(divId: string) {
    const { sciChartSurface, wasmContext } = await SciChartSurface.create(divId);
    sciChartSurface.xAxes.add(new NumericAxis(wasmContext));
    sciChartSurface.yAxes.add(new NumericAxis(wasmContext, { growBy: new NumberRange(0.05, 0.05) }));
    const xLineValues = [0, 1, 2, 3, 4, 5, 6, 7, 8];
    const yLine1Values = [0, 0.5, 1.3, 2.4, 3, 2.5, 2.2, 1.9, 1.2];
    const yLine2Values = [1, 1.1, 1.4, 1.3, 1.05, 0.8, 0.6, 0.5, 0.4];
    const lineSeries1 = new FastLineRenderableSeries(wasmContext, {
        stroke: 'red',
        strokeThickness: 3,
        dataSeries: new XyDataSeries(wasmContext, {
            dataSeriesName: 'Red Series',
            xValues: xLineValues,
            yValues: yLine1Values
        })
    });
    sciChartSurface.renderableSeries.add(lineSeries1);
    const lineSeries2 = new FastLineRenderableSeries(wasmContext, {
        stroke: 'green',
        strokeThickness: 3,
        dataSeries: new XyDataSeries(wasmContext, {
            dataSeriesName: 'Green Series',
            xValues: xLineValues,
            yValues: yLine2Values
        })
    });
    sciChartSurface.renderableSeries.add(lineSeries2);
    // External placement
    sciChartSurface.chartModifiers.add(new LegendModifier({ placementDivId: "legend-div-id" }));
}

 The result will be.

See Also