
AxisMarkerAnnotation
The AxisMarkerAnnotation allows you to add a label on to the Axis at a specific X or Y value.
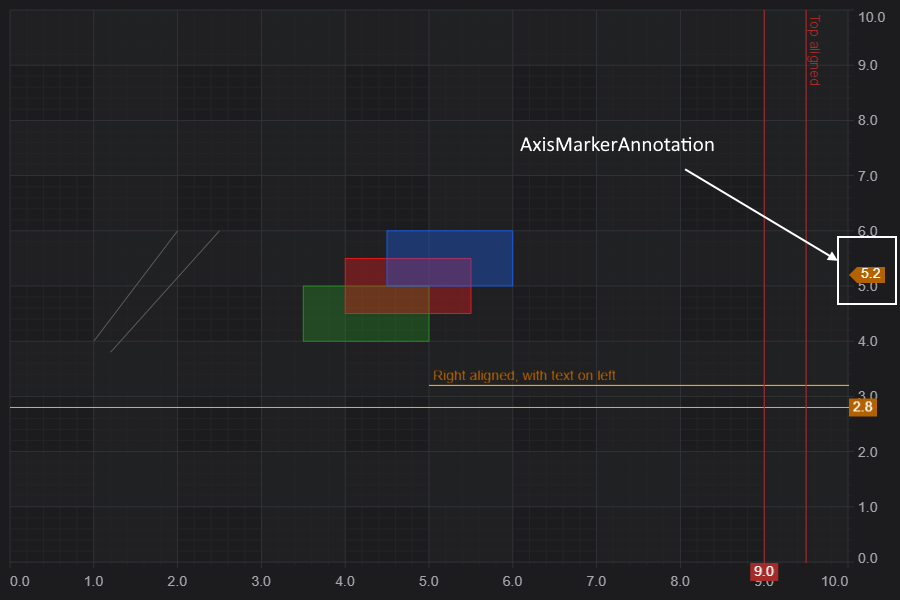
Declaring a AxisMarkerAnnotation in code
The following code will declare an AxisMarkerAnnotation add it to the chart.
Results in the following output:
<div id="scichart-root"></div>
body {
margin: 0;
}
#scichart-root {
width: 100%;
height: 100vh;
}
// #region ExampleA
const {
  AxisMarkerAnnotation,
  NumericAxis,
  SciChartSurface,
  ELabelPlacement,
  SciChartJsNavyTheme,
} = SciChart;

// or for npm import { SciChartSurface, ... } from "scichart"

async function addAnnotationToChart(divElementId) {
  const { wasmContext, sciChartSurface } = await SciChartSurface.create(
    divElementId,
    {
      theme: new SciChartJsNavyTheme(),
    }
  );
  sciChartSurface.xAxes.add(new NumericAxis(wasmContext));
  sciChartSurface.yAxes.add(new NumericAxis(wasmContext));

  // Add a selection of annotations to the chart
  sciChartSurface.annotations.add(
    // An AxisMarkerAnnotation at Y=5.2 showing the y-value
    new AxisMarkerAnnotation({
      y1: 5.2,
      fontSize: 20,
      fontStyle: "Bold",
      backgroundColor: "SteelBlue",
      color: "White",
      fontFamily: "Arial",
      fontWeight: 700,
    }),
    // An AxisMarkerAnnotation at Y=7 with a custom label
    new AxisMarkerAnnotation({
      y1: 7,
      fontSize: 16,
      fontStyle: "Bold",
      backgroundColor: "#FF6600",
      color: "Black",
      fontFamily: "Arial",
      formattedValue: "Custom Label",
    })
  );
}

addAnnotationToChart("scichart-root");
// #endregion
async function builderExample(divElementId) {
// #region ExampleB
const { chartBuilder, EAnnotationType } = SciChart;

// or for npm import { SciChartSurface, ... } from "scichart"

const { wasmContext, sciChartSurface } = await chartBuilder.build2DChart(
  divElementId,
  {
    annotations: [
      {
        type: EAnnotationType.RenderContextAxisMarkerAnnotation,
        options: {
          y1: 5.2,
          fontSize: 12,
          fontStyle: "Bold",
          backgroundColor: "SteelBlue",
          color: "White",
          fontFamily: "Arial",
        },
      },
      {
        type: EAnnotationType.RenderContextAxisMarkerAnnotation,
        options: {
          y1: 7,
          fontSize: 16,
          fontStyle: "Bold",
          backgroundColor: "#FF6600",
          color: "Black",
          fontFamily: "Arial",
          formattedValue: "Custom Label",
        },
      },
    ],
  }
);
// #endregion
}
// Uncomment this to use the builder example //builderExample("scichart-root");
Styling the AxisMarkerAnnotation
The following properties can be set to style the AxisMarkerAnnotation:
| Property | Description |
| backgroundColor | The box fill color for the axis label |
| color | The text-color for the axis label |
| fontFamily | The font family for the axis label text |
| fontSize | The font size for the axis label text |
| fontStyle | The font style, e.g. Bold or Italic for the axis label text |
| formattedValue | The formatted value on the axis label. This defaults to the Y-value formatted by the yAxis.labelProvider. This can be overridden by a custom label value by setting this property. |
| annotationGripsFill | The fill color for the annotations grips when editing (dragging) |
| annotationsGripsRadius | The radius for the annotations grips when editing (dragging) |
| annotationGripsStroke | The stroke color for the annotations grips when editing. |
Creating an AxisMarkerAnnotation
See Also