import { SciChartSurface } from 'scichart/Charting/Visuals/SciChartSurface';
import { NumericAxis } from 'scichart/Charting/Visuals/Axis/NumericAxis';
import { XyDataSeries } from 'scichart/Charting/Model/XyDataSeries';
import { FastLineRenderableSeries } from 'scichart/Charting/Visuals/RenderableSeries/FastLineRenderableSeries';
import { NumberRange } from 'scichart/Core/NumberRange';
import { XyMovingAverageFilter } from 'scichart/Charting/Model/Filters/XyMovingAverageFilter';
...
const { sciChartSurface, wasmContext } = await SciChartSurface.create('scichart-div-id-4');
sciChartSurface.xAxes.add(new NumericAxis(wasmContext, { growBy: new NumberRange(0.1, 0.1) }));
sciChartSurface.yAxes.add(new NumericAxis(wasmContext, { growBy: new NumberRange(0.01, 0.01), autoRange: EAutoRange.Always }));
// A function to get some data - sinewave plus a randm factor
const getData = (start, count) => {
let xValues = [];
let yValues = [];
for (let i = start; i < start + count; i++) {
xValues.push(i);
yValues.push(2 * Math.sin(i/10) + Math.random());
}
return { xValues, yValues };
};
// Original Data
const dataSeries = new XyDataSeries(wasmContext, getData(0, 100));
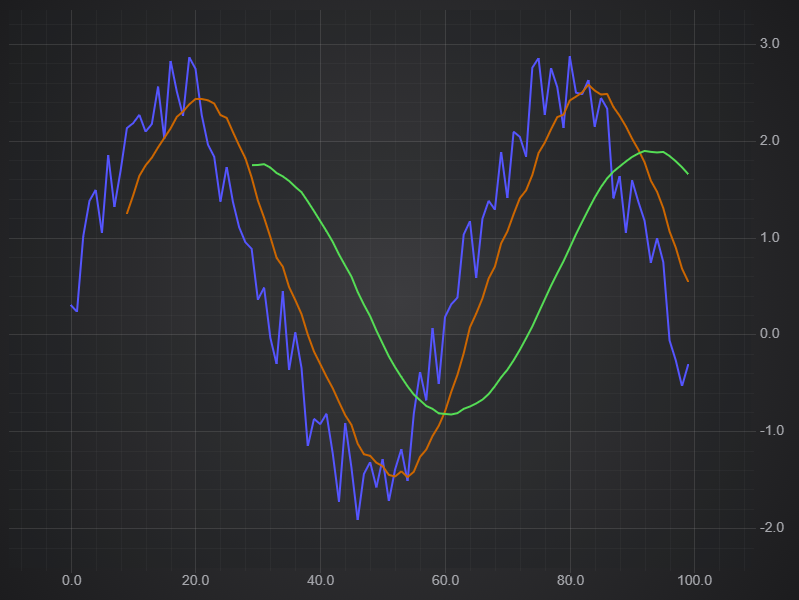
const originalLine = new FastLineRenderableSeries(wasmContext, { dataSeries, stroke: "#5555ff", strokeThickness: 3 });
// Create the filter, passing in the original series
const movingAverage = new XyMovingAverageFilter(dataSeries, { length: 10 });
const filteredLine = new FastLineRenderableSeries(wasmContext, { dataSeries: movingAverage, stroke: "#cc6600", strokeThickness: 3 });
// Another filter using the same original data, but different length
const movingAverage30 = new XyMovingAverageFilter(dataSeries, { length: 30});
const filteredLine30 = new FastLineRenderableSeries(wasmContext, { dataSeries: movingAverage30, stroke: "#55dd55", strokeThickness: 3 });
sciChartSurface.renderableSeries.add(originalLine, filteredLine, filteredLine30);