SciChart.js JavaScript 2D Charts API > Annotations API > Custom AxisMarkerAnnotation
Custom AxisMarkerAnnotation

SciChart.js allows to create custom axis marker annotations on axes. This is done by creating AxisMarkerAnnotation and passing an image option into the constructor.

const customAxisMarkerAnnotation = new AxisMarkerAnnotation({
    x1: 2,
    isEditable: true,
    image: htmlImageElement,
});

The full example code is below.

import customAxisMarkerImage from './img/CustomAxisMarkerImage.png';
import {
          SciChartSurface ,
          NumericAxis ,
          NumberRange ,
          createImageAsync,
          AxisMarkerAnnotation
} from "SciChart";
export async function customAxisMarkerAnnotationTs(divId) {
    const { sciChartSurface, wasmContext } = await SciChartSurface.create(divId);
    sciChartSurface.xAxes.add(new NumericAxis(wasmContext, { visibleRange: new NumberRange(0, 10) }));
    sciChartSurface.yAxes.add(new NumericAxis(wasmContext, { visibleRange: new NumberRange(0, 10) }));
    const htmlImageElement = await createImageAsync(customAxisMarkerImage);
    // pass imageWidth and imageHeight options to specify annotation width and height
    const customAxisMarkerAnnotation = new AxisMarkerAnnotation({
        x1: 2,
        isEditable: true,
        image: htmlImageElement,
        // imageWidth: 100,
        // imageHeight: 100
    });
    sciChartSurface.annotations.add(customAxisMarkerAnnotation);
}
import { SciChartSurface } from 'scichart/Charting/Visuals/SciChartSurface';
import { NumericAxis } from 'scichart/Charting/Visuals/Axis/NumericAxis';
import customAxisMarkerImage from './img/CustomAxisMarkerImage.png';
import { NumberRange } from 'scichart/Core/NumberRange';
import { createImageAsync } from 'scichart/utils/imageUtil';
import { AxisMarkerAnnotation } from 'scichart/Charting/Visuals/Annotations/AxisMarkerAnnotation';
export async function customAxisMarkerAnnotationTs(divId: string) {
    const { sciChartSurface, wasmContext } = await SciChartSurface.create(divId);
    sciChartSurface.xAxes.add(new NumericAxis(wasmContext, { visibleRange: new NumberRange(0, 10) }));
    sciChartSurface.yAxes.add(new NumericAxis(wasmContext, { visibleRange: new NumberRange(0, 10) }));
    const htmlImageElement = await createImageAsync(customAxisMarkerImage);
    // pass imageWidth and imageHeight options to specify annotation width and height
    const customAxisMarkerAnnotation = new AxisMarkerAnnotation({
        x1: 2,
        isEditable: true,
        image: htmlImageElement,
        // imageWidth: 100,
        // imageHeight: 100
    });
    sciChartSurface.annotations.add(customAxisMarkerAnnotation);
}

In this example we are using webpack url-loader to load customAxisMarkerImage and createImageAsync helper function to create htmlImageElement.

This give us a chart with just two axes and an annotation.
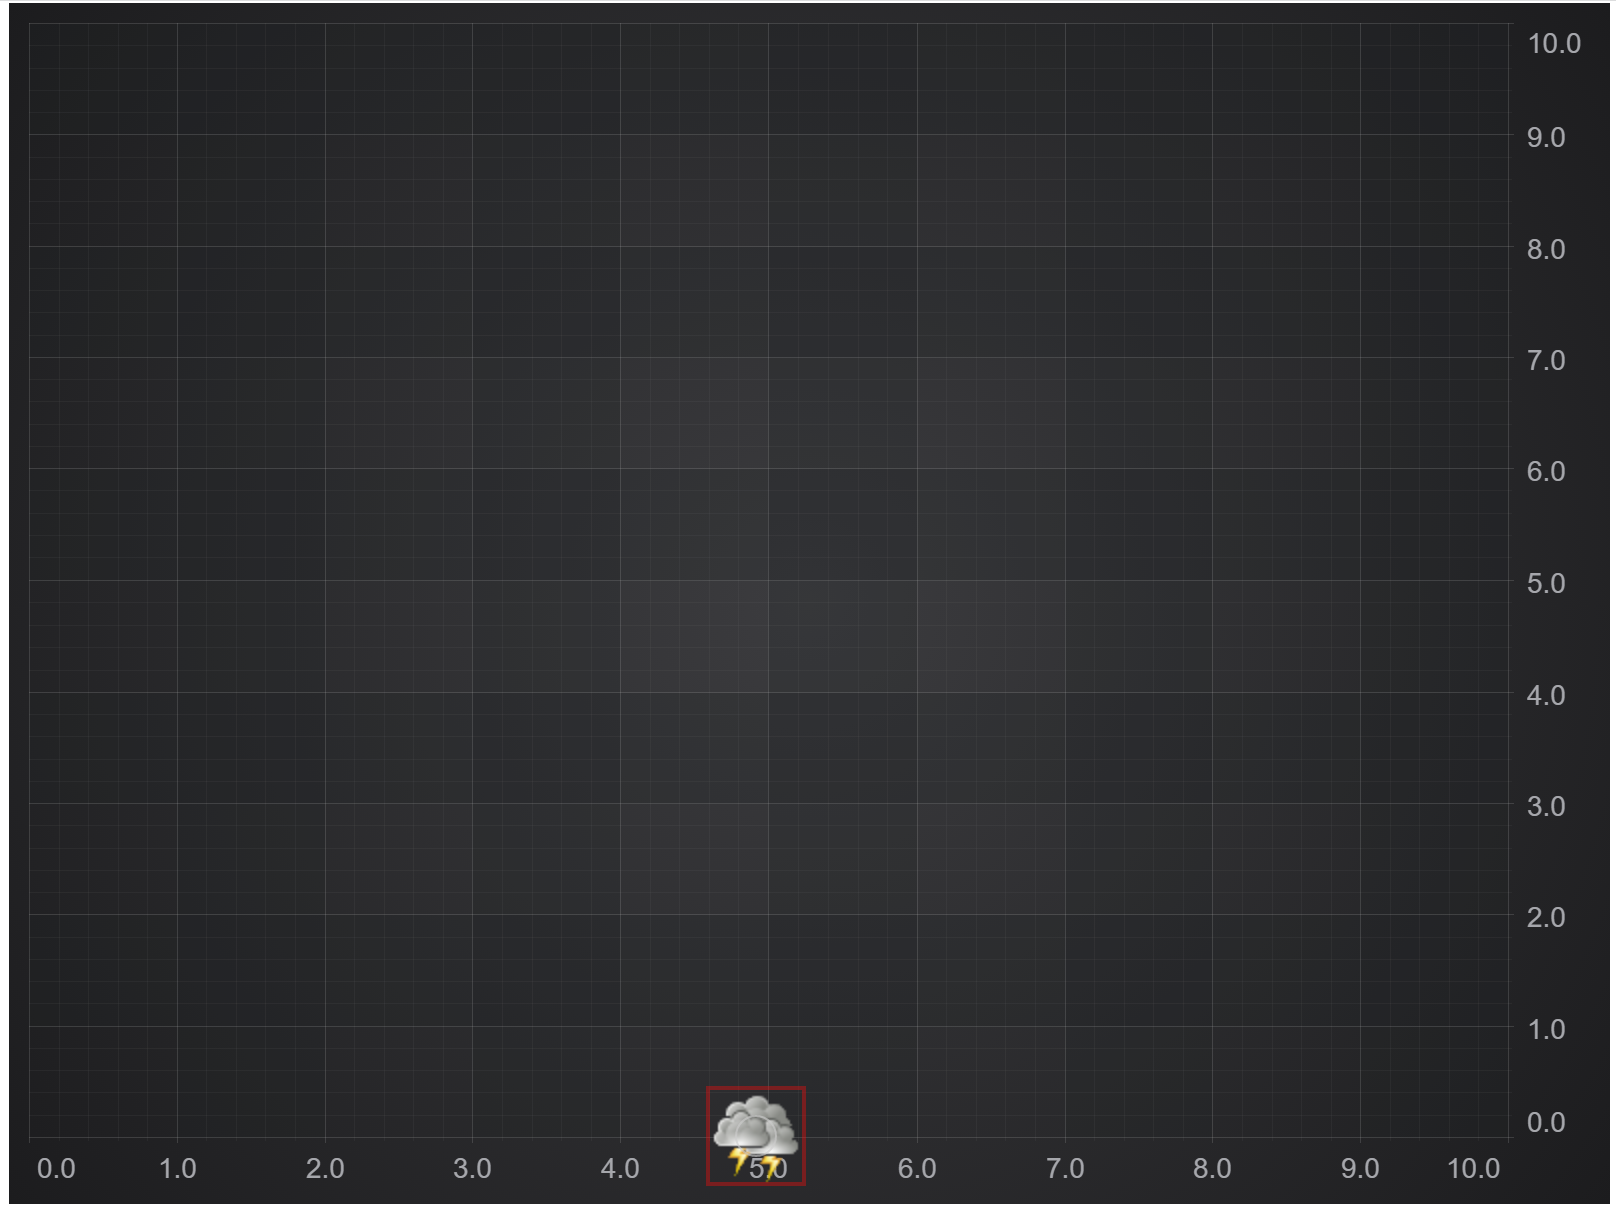
 On the chart we can see a cloud-shaped custom axis label annotation. The annotation is draggable along the X Axis.

It is also possible to set width and height using imageWidth and imageHeight options.

const customAxisMarkerAnnotation = new AxisMarkerAnnotation({
    x1: 5,
    isEditable: true,
    image: htmlImageElement,
    imageWidth: 100,
    imageHeight: 100
});
See Also