
 |
The CustomAnnotation type draws a custom shape defined by SVG at the x1,y1 location where coordinates are data-values. Coordinates may be relative or absolute according to xCoordinateMode, yCoordinateMode. |
Declaring a CustomAnnotation in code
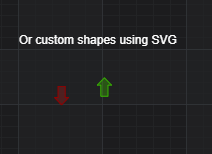
The following code will declare a a CustomAnnotation with a Rocket icon rendered in SVG. This is added to the chart at specific X and Y locations.
This results in the following output:
<div id="scichart-root"></div>
body {
margin: 0;
}
#scichart-root {
width: 100%;
height: 100vh;
}
// #region ExampleA
const {
  BoxAnnotation,
  CustomAnnotation,
  LineAnnotation,
  TextAnnotation,
  NumericAxis,
  SciChartSurface,
  NumberRange,
  EHorizontalAnchorPoint,
  EVerticalAnchorPoint,
  ECoordinateMode,
  SciChartJsNavyTheme,
} = SciChart;

// or for npm import { SciChartSurface, ... } from "scichart"

async function addAnnotationToChart(divElementId) {
  const { wasmContext, sciChartSurface } = await SciChartSurface.create(
    divElementId,
    {
      theme: new SciChartJsNavyTheme(),
    }
  );
  sciChartSurface.xAxes.add(new NumericAxis(wasmContext));
  sciChartSurface.yAxes.add(new NumericAxis(wasmContext));

  const rocketSvg = `<?xml version="1.0" ?><!DOCTYPE svg  PUBLIC '-//W3C//DTD SVG 1.1//EN'  'http://www.w3.org/Graphics/SVG/1.1/DTD/svg11.dtd'>
    <svg height="64.013px" id="Layer_1" style="enable-background:new 0 0 64.02 64.013;" version="1.1" viewBox="0 0 64.02 64.013" width="64.02px" xml:space="preserve" xmlns="http://www.w3.org/2000/svg" xmlns:xlink="http://www.w3.org/1999/xlink">
      <g id="Legs"><g><path d="M38,36.013l-6,6l-4,4v6l-6,10l4,2l14-14L38,36.013z     M28,26.013l-14-2l-14,14l2,4l10-6h6l4-4L28,26.013z" style="fill-rule:evenodd;clip-rule:evenodd;fill:#CCCCCC;"/></g></g>
      <g id="Flames"><g><path d="M10,44.013c-3.939,5.748-9.974,12.835-10,16c-0.021,2.403,1.576,4.021,4,4    c3.217-0.027,10.011-6.031,16-10L10,44.013z" style="fill:#FFCC66;"/></g></g><g id="Flames_1_"><g><path d="M16,42.013c-3.939,5.748-12,12.835-12,16c0,2.091,0.201,2,2,2c3.217,0,10.011-8.031,16-12    L16,42.013z" style="fill:#ED7161;"/></g></g>
      <g id="Body_2_"><g><path d="M60,0.013c-6.286,0.389-17.138,1.137-30,14C20.539,23.474,12.239,37.231,8.348,46.36l9.367,9.367    C26.793,51.874,40.459,43.553,50,34.013c12.779-12.779,13.507-23.669,14-30C64.22,1.187,62.614-0.149,60,0.013z" style="fill:#387AA7;"/></g></g>
      <g id="Body_3_"><g><path d="M60,0.013c-6.286,0.389-17.138,1.137-30,14c-7.724,7.723-14.664,18.307-19.078,26.905    l12.235,12.235C31.703,48.751,42.222,41.791,50,34.013c12.779-12.779,13.507-23.669,14-30C64.22,1.187,62.614-0.149,60,0.013z" style="fill:#48A0DC;"/></g></g>
      <g id="Glass"><g><circle cx="48" cy="16.013" r="8" style="fill:#4D4D4D;"/></g></g>
      <g id="Glass_1_"><g><circle cx="48" cy="16.013" r="4" style="fill:#FFFFFF;"/></g></g></svg>`;

  // Add a selection of annotations to the chart
  sciChartSurface.annotations.add(
    new CustomAnnotation({
      x1: 4,
      y1: 5,
      svgString: rocketSvg,
    })
  );
}

addAnnotationToChart("scichart-root");
// #endregion
async function builderExample(divElementId) {
// #region ExampleB
const { chartBuilder, EAnnotationType } = SciChart;

// or for npm import { SciChartSurface, ... } from "scichart"

const rocketSvg = `<?xml version="1.0" ?><!DOCTYPE svg  PUBLIC '-//W3C//DTD SVG 1.1//EN'  'http://www.w3.org/Graphics/SVG/1.1/DTD/svg11.dtd'>
  <svg height="64.013px" id="Layer_1" style="enable-background:new 0 0 64.02 64.013;" version="1.1" viewBox="0 0 64.02 64.013" width="64.02px" xml:space="preserve" xmlns="http://www.w3.org/2000/svg" xmlns:xlink="http://www.w3.org/1999/xlink">
    <g id="Legs"><g><path d="M38,36.013l-6,6l-4,4v6l-6,10l4,2l14-14L38,36.013z     M28,26.013l-14-2l-14,14l2,4l10-6h6l4-4L28,26.013z" style="fill-rule:evenodd;clip-rule:evenodd;fill:#CCCCCC;"/></g></g>
    <g id="Flames"><g><path d="M10,44.013c-3.939,5.748-9.974,12.835-10,16c-0.021,2.403,1.576,4.021,4,4    c3.217-0.027,10.011-6.031,16-10L10,44.013z" style="fill:#FFCC66;"/></g></g><g id="Flames_1_"><g><path d="M16,42.013c-3.939,5.748-12,12.835-12,16c0,2.091,0.201,2,2,2c3.217,0,10.011-8.031,16-12    L16,42.013z" style="fill:#ED7161;"/></g></g>
    <g id="Body_2_"><g><path d="M60,0.013c-6.286,0.389-17.138,1.137-30,14C20.539,23.474,12.239,37.231,8.348,46.36l9.367,9.367    C26.793,51.874,40.459,43.553,50,34.013c12.779-12.779,13.507-23.669,14-30C64.22,1.187,62.614-0.149,60,0.013z" style="fill:#387AA7;"/></g></g>
    <g id="Body_3_"><g><path d="M60,0.013c-6.286,0.389-17.138,1.137-30,14c-7.724,7.723-14.664,18.307-19.078,26.905    l12.235,12.235C31.703,48.751,42.222,41.791,50,34.013c12.779-12.779,13.507-23.669,14-30C64.22,1.187,62.614-0.149,60,0.013z" style="fill:#48A0DC;"/></g></g>
    <g id="Glass"><g><circle cx="48" cy="16.013" r="8" style="fill:#4D4D4D;"/></g></g>
    <g id="Glass_1_"><g><circle cx="48" cy="16.013" r="4" style="fill:#FFFFFF;"/></g></g></svg>`;

const { wasmContext, sciChartSurface } = await chartBuilder.build2DChart(
  divElementId,
  {
    annotations: [
      {
        type: EAnnotationType.SVGCustomAnnotation,
        options: {
          x1: 5,
          y1: 5,
          verticalAnchorPoint: EVerticalAnchorPoint.Top,
          horizontalAnchorPoint: EHorizontalAnchorPoint.Center,
          svgString: rocketSvg,
        },
      },
    ],
  }
);
// #endregion
}
// Uncomment this to use the builder example //builderExample("scichart-root");
Notice that the SVG string is W3C compliant SVG. Lots of sources online have SVG icons that you can download, or you can create your own vector graphics using a tool like Figma, Inkscape or Adobe Illustrator.
Positioning a CustomAnnotation with horizontal/vertical Anchor Points
A CustomAnnotation only requires coordinates x1,y1 to be set. The alignment of the annotation around this coordinate is controlled by the horizontalAnchorPoint, verticalAnchorPoint properties.
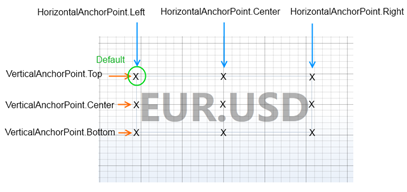
Above: Set the horizontalAnchorPoint, and verticalAnchorPoint property to determine which anchor point (horizontal: left, center, right or vertical: top, center, bottom) the x1,y2 coordinate is bound to.
Aligning a CustomAnnotation with x/yCoordinateModes
Like other annotation types, the CustomAnnotation can be positioned relatively or absolute using xCoordinateMode, yCoordinateMode property.
For example. The TradeMarkers demo in the SciChart.js Examples Suite places a number of custom annotations for buy/sell markers, but also places news bullet annotations at the bottom of the chart using yCoordinateMode.
This results in the following output:
<div id="scichart-root"></div>
body {
  margin: 0;
}
#scichart-root {
  width: 100%;
  height: 100vh;
}
const candlestickData = {
dateValues: [
1009141200, 1009227600, 1009314000, 1009400400, 1009486800, 1009746000,
1009832400, 1009918800, 1010005200, 1010091600, 1010350800, 1010437200,
1010523600, 1010610000, 1010696400, 1010955600, 1011042000, 1011128400,
1011214800, 1011301200, 1011560400, 1011646800, 1011733200, 1011819600,
1011906000, 1012165200, 1012251600, 1012338000, 1012424400, 1012510800,
],
highValues: [
0.891, 0.8826, 0.8823, 0.8873, 0.8861, 0.8924, 0.8913, 0.9069, 0.9061,
0.9003, 0.8998, 0.8939, 0.8954, 0.8941, 0.8934, 0.8956, 0.8947, 0.8847,
0.8854, 0.8853, 0.8869, 0.8877, 0.8892, 0.8796, 0.8788, 0.8666, 0.8661,
0.8677, 0.8647, 0.8644,
],
lowValues: [
0.8741, 0.8767, 0.8765, 0.8774, 0.8788, 0.8824, 0.8863, 0.8883, 0.8974,
0.8938, 0.8881, 0.8882, 0.8864, 0.89, 0.8895, 0.8914, 0.882, 0.8802, 0.8793,
0.8795, 0.8824, 0.8811, 0.8765, 0.8752, 0.8631, 0.857, 0.8592, 0.8599,
0.8576, 0.8562,
],
closeValues: [
0.879, 0.8791, 0.8804, 0.8836, 0.8853, 0.8899, 0.8895, 0.9033, 0.8993,
0.8948, 0.8934, 0.8933, 0.8912, 0.8914, 0.8922, 0.8942, 0.8836, 0.8836,
0.8812, 0.8845, 0.8833, 0.8867, 0.8774, 0.8777, 0.8644, 0.8619, 0.8652,
0.8623, 0.8592, 0.8622,
],
openValues: [
0.8888, 0.8791, 0.8791, 0.8803, 0.8836, 0.8841, 0.8897, 0.8896, 0.9032,
0.8992, 0.895, 0.8934, 0.8933, 0.8912, 0.8914, 0.8945, 0.8942, 0.8835,
0.8836, 0.8814, 0.884, 0.8834, 0.8864, 0.8774, 0.8777, 0.8645, 0.8618,
0.8652, 0.8621, 0.8593,
],
};
// #region ExampleA
const {
  BoxAnnotation,
  CustomAnnotation,
  LineAnnotation,
  TextAnnotation,
  NumericAxis,
  SciChartSurface,
  NumberRange,
  EHorizontalAnchorPoint,
  EVerticalAnchorPoint,
  ECoordinateMode,
  SciChartJsNavyTheme,
  FastCandlestickRenderableSeries,
  OhlcDataSeries,
  CategoryAxis,
  SmartDateLabelProvider,
} = SciChart;

// or for npm import { SciChartSurface, ... } from "scichart"

async function addAnnotationToChart(divElementId) {
  const { wasmContext, sciChartSurface } = await SciChartSurface.create(
    divElementId,
    {
      theme: new SciChartJsNavyTheme(),
    }
  );
  sciChartSurface.xAxes.add(
    new CategoryAxis(wasmContext, {
      labelProvider: new SmartDateLabelProvider(),
    })
  );
  sciChartSurface.yAxes.add(new NumericAxis(wasmContext));

  const { dateValues, openValues, highValues, lowValues, closeValues } =
    candlestickData;

  // console.log(multiPaneDataSlice);

  sciChartSurface.renderableSeries.add(
    new FastCandlestickRenderableSeries(wasmContext, {
      dataSeries: new OhlcDataSeries(wasmContext, {
        xValues: dateValues,
        openValues,
        highValues,
        lowValues,
        closeValues,
      }),
    })
  );

  // Returns a CustomAnnotation that represents a buy marker arrow
  // The CustomAnnotation supports SVG as content. Using Inkscape or similar you can create SVG content for annotations
  const buyMarkerAnnotation = (x1, y1) => {
    return new CustomAnnotation({
      x1,
      y1,
      verticalAnchorPoint: EVerticalAnchorPoint.Top,
      horizontalAnchorPoint: EHorizontalAnchorPoint.Center,
      svgString:
        '<svg id="Capa_1" xmlns="http://www.w3.org/2000/svg">' +
        '<g transform="translate(-53.867218,-75.091687)">' +
        '<path style="fill:#1cb61c;fill-opacity:0.34117647;stroke:#00b400;stroke-width:1px;stroke-linecap:butt;stroke-linejoin:miter;stroke-opacity:1"' +
        'd="m 55.47431,83.481251 c 7.158904,-7.408333 7.158904,-7.408333 7.158904,-7.408333 l 7.158906,7.408333 H 66.212668 V 94.593756 H 59.053761 V 83.481251 Z"' +
        "/>" +
        "</g>" +
        "</svg>",
    });
  };

  // Returns a CustomAnnotation that represents a sell marker arrow
  // The CustomAnnotation supports SVG as content. Using Inkscape or similar you can create SVG content for annotations
  const sellMarkerAnnotation = (x1, y1) => {
    return new CustomAnnotation({
      x1,
      y1,
      verticalAnchorPoint: EVerticalAnchorPoint.Bottom,
      horizontalAnchorPoint: EHorizontalAnchorPoint.Center,
      svgString:
        '<svg id="Capa_1" xmlns="http://www.w3.org/2000/svg">' +
        '<g transform="translate(-54.616083,-75.548914)">' +
        '<path style="fill:#b22020;fill-opacity:0.34117648;stroke:#990000;stroke-width:1px;stroke-linecap:butt;stroke-linejoin:miter;stroke-opacity:1"' +
        'd="m 55.47431,87.025547 c 7.158904,7.408333 7.158904,7.408333 7.158904,7.408333 L 69.79212,87.025547 H 66.212668 V 75.913042 h -7.158907 v 11.112505 z"' +
        "/>" +
        "</g>" +
        "</svg>",
    });
  };

  const newsBulletAnnotation = (x1) => {
    return new CustomAnnotation({
      x1,
      y1: 0.99, // using YCoordinateMode.Relative and 0.99, places the annotation at the bottom of the viewport
      yCoordinateMode: ECoordinateMode.Relative,
      verticalAnchorPoint: EVerticalAnchorPoint.Bottom,
      horizontalAnchorPoint: EHorizontalAnchorPoint.Center,
      svgString:
        '<svg id="Capa_1" xmlns="http://www.w3.org/2000/svg">' +
        "  <g" +
        '     inkscape:label="Layer 1"' +
        '     inkscape:groupmode="layer"' +
        '     id="layer1"' +
        '     transform="translate(-55.430212,-77.263552)">' +
        "    <rect" +
        '       style="fill:#C0D4EE;fill-opacity:1;stroke:#333333;stroke-width:0.26458332;stroke-miterlimit:4;stroke-dasharray:none;stroke-opacity:0.66666667"' +
        '       id="rect4528"' +
        '       width="13.229166"' +
        '       height="15.875"' +
        '       x="55.562504"' +
        '       y="77.395844"' +
        '       rx="2"' +
        '       ry="2" />' +
        "    <text" +
        '       xml:space="preserve"' +
        '       style="font-style:normal;font-weight:normal;font-size:10.58333302px;line-height:1.25;font-family:sans-serif;letter-spacing:0px;word-spacing:0px;fill:#333333;fill-opacity:1;stroke:none;stroke-width:0.26458332"' +
        '       x="57.688622"' +
        '       y="89.160347"' +
        '       id="text4540"><tspan' +
        '         sodipodi:role="line"' +
        '         id="tspan4538"' +
        '         x="57.688622"' +
        '         y="89.160347"' +
        "         style=\"font-style:normal;font-variant:normal;font-weight:bold;font-stretch:normal;font-family:sans-serif;-inkscape-font-specification:'sans-serif Bold';fill:#333333;fill-opacity:1;stroke-width:0.26458332\">N</tspan></text>" +
        "  </g>" +
        "</svg>",
    });
  };

  // Add some trades to the chart using the Annotations API
  for (let i = 0; i < dateValues.length; i++) {
    // Every 4th bar, add a buy annotation
    if (i % 4 === 0) {
      sciChartSurface.annotations.add(buyMarkerAnnotation(i, lowValues[i]));
    }
    // Every 4th bar between buys, add a sell annotation
    if ((i + 2) % 4 === 0) {
      sciChartSurface.annotations.add(sellMarkerAnnotation(i, highValues[i]));
    }
    // Every 10th bar, add a news bullet
    if (i % 10 === 0) {
      sciChartSurface.annotations.add(newsBulletAnnotation(i));
    }
  }
}

addAnnotationToChart("scichart-root");
// #endregion