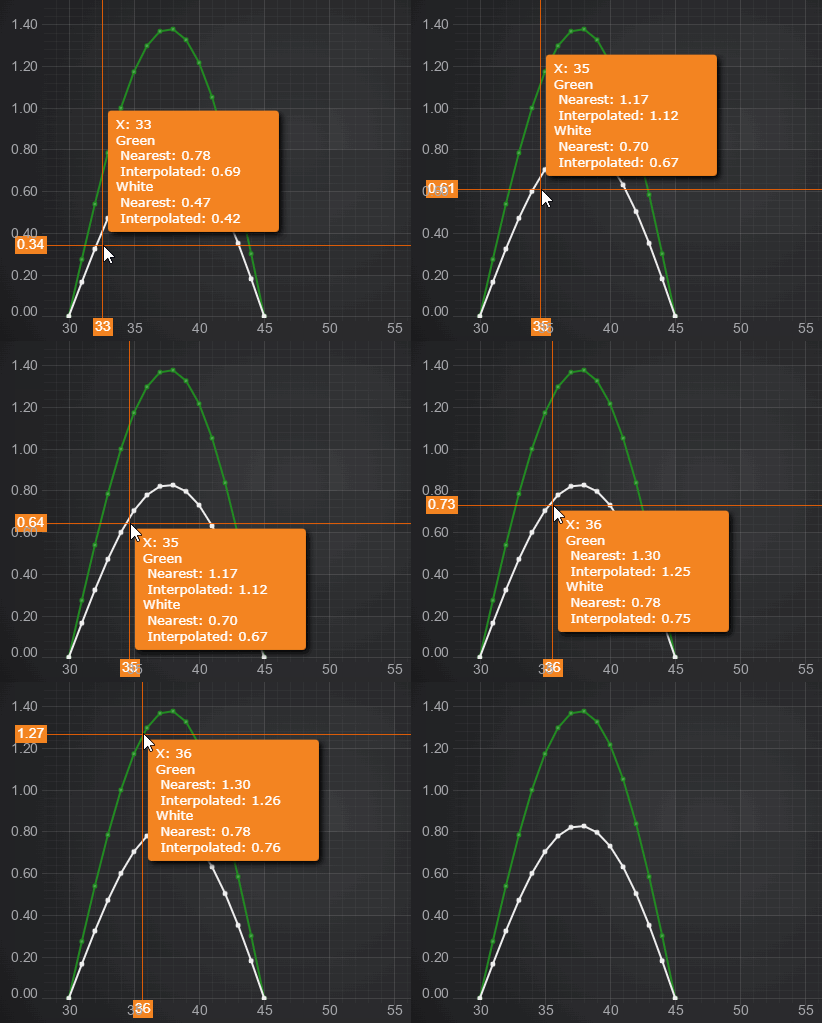
In SciChart.JS v3 we added some additional properties to the hitTestInfo object so you can now get full information about the points either side of the hit-test location. This allows you to do interpolation for your tooltip values rather than just showing values at the actual data points.
xValue and yValue are always the values nearest the cursor. point2xValue and point2vValue are the points on the other side of the cursor. The interpolate function does linear interpoltion to find the y value for the x coordinate of the line between those points.
This example uses a CursorModifier, but the same principle would apply to RolloverModifier. The difference is that the CursorModifier tooltipDataTemplate takes an array of seriesInfo because it is one tooltip for all series, whereas RolloverModifier does one tooltip per series.
| Interpolated ToolTip |
Copy Code
|
|---|---|
const interpolate = (x1: number, x2: number, y1: number, y2: number, x: number) => {
    return y1 + ((y2 - y1) * (x - x1)) / (x2 - x1);
};
const interpolatedTooltipDataTemplate: TCursorTooltipDataTemplate = (
    seriesInfos: SeriesInfo[],
    tooltipTitle: string
) => {
    const valuesWithLabels: string[] = [];
    seriesInfos.forEach((si, index) => {
        if (si.isHit) {
            if (index === 0) valuesWithLabels.push("X: " + si.getXCursorFormattedValue(si.hitTestPointValues.x));
            const xySeriesInfo = si as XySeriesInfo;
            const yValue = interpolate (
                xySeriesInfo.xValue,
                xySeriesInfo.point2xValue,
                xySeriesInfo.yValue,
                xySeriesInfo.point2yValue,
                xySeriesInfo.hitTestPointValues.x
            );
            const seriesTitle = si.seriesName ? si.seriesName : `Series #${index + 1}`;
            valuesWithLabels.push(seriesTitle);
            valuesWithLabels.push(`  Nearest: ${xySeriesInfo.formattedYValue}`);
            valuesWithLabels.push(`  Interpolated: ${xySeriesInfo.getYCursorFormattedValue(yValue)}`);
        }
    });
    return valuesWithLabels;
};
// Apply this to a cursorModifier
const cursorModifier = new CursorModifier({
        crosshairStroke: "#ff6600",
        crosshairStrokeThickness: 1,
        tooltipContainerBackground: "#F48420",
        showTooltip: true,
        axisLabelFill: "#F48420",
        axisLabelStroke: "#fff",
        tooltipDataTemplate: interpolatedTooltipDataTemplate
});
|
|

