
SciChart.js provides a mouse-over tooltips behavior via the RolloverModifier, available out of the box.
Besides common features which are inherited from the ChartModifierBase class, the RolloverModifier allows adding custom or standard tooltips to a chart (per series), and consuming the tooltip data in another area of your UI (custom legends).
Adding a RolloverModifier to a Chart
A RolloverModifier can be added to the sciChartSurface.chartModifiers collection to enable tooltip behavior. For example:
|
Copy Code
|
|
|---|---|
// Create a SciChartSurface const { sciChartSurface, wasmContext } = await SciChartSurface.create(divElementId); // Add RolloverModifier behavior sciChartSurface.chartModifiers.add(new RolloverModifier()); |
|
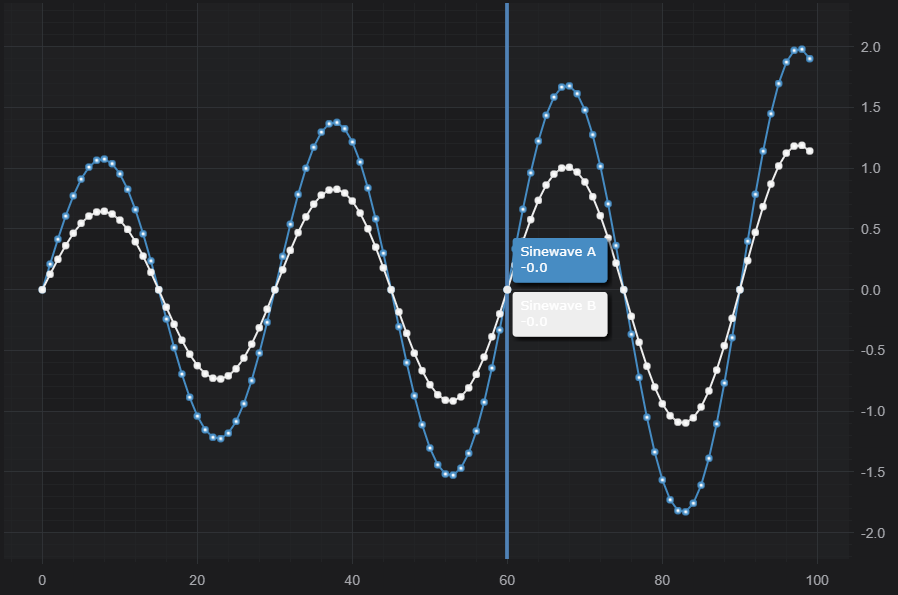
This results in the following behavior:
This is a basic implementation of the tooltip. You will notice that the text color on the White series is not visible. We will describe how to customise the tooltip including style and appearance below.
Customizing the Rollover Appearance
Styling the Vertical Line
The Rollover Line itself can be styled by setting the rolloverLineStrokeThickness or rolloverLineStroke properties as follows. It can also be hidden with the showRolloverLine property.
| Styling the RolloverLine |
Copy Code
|
|---|---|
const rolloverModifier = new RolloverModifier(); rolloverModifier.rolloverLineStroke = "SteelBlue"; rolloverModifier.rolloverLineStrokeThickness = 5; rolloverModifier.showRolloverLine = true; sciChartSurface.chartModifiers.add(rolloverModifier); |
|
Which results in the following.
Styling the Tooltip
The Tooltip itself can be styled by setting the properties as follows.
| Styling the Tooltip |
Copy Code
|
|---|---|
const rendSeries = new FastBandRenderableSeries(wasmContext, { dataSeries, strokeThickness: 2 }); rendSeries.rolloverModifierProps.tooltipTextColor = "SteelBlue"; rendSeries.rolloverModifierProps.tooltipColor = "Pink"; rendSeries.rolloverModifierProps.tooltipLabelX = "X"; // X value will be hidden if X label is not set rendSeries.rolloverModifierProps.tooltipLabelY = "Label Y"; // For Band series in order to set Y1 Tooltip use rolloverModifierProps1 like rendSeries.rolloverModifierProps1.width = 70; // here you can set the width manually rendSeries.rolloverModifierProps1.tooltipLabelY = "Y1"; |
|
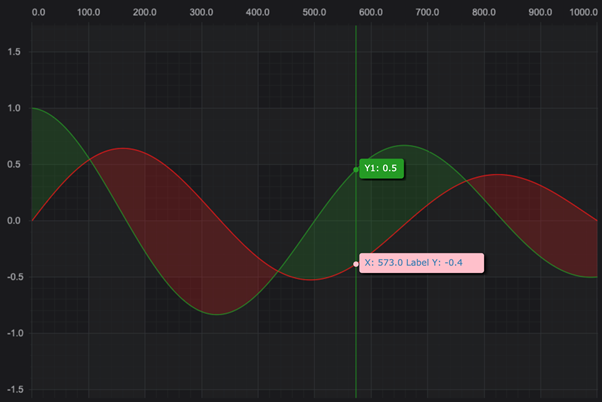
This results in the following:
Placing the tooltip outside the chart
The tooltip can be placed anywhere on the chart by setting the RolloverModifier.placementDivId property.
Simply add this code when declaring the rollover:
| Styling the Tooltip |
Copy Code
|
|---|---|
new RolloverModifier({ placementDivId: "tooltip-div-id" }); |
|
Styling the Series RolloverMarker
The RolloverMarker is the small dot which intersects the rollover line and the series itself. By default this is set to the series stroke color.
You can change the market color by setting the property renderableSeries.rolloverModifierProps.markerColor to an HTML color code. e.g.
| Styling the Tooltip |
Copy Code
|
|---|---|
const rendSeries = new FastBandRenderableSeries(wasmContext, { dataSeries, strokeThickness: 2 }); rendSeries.rolloverModifierProps.markerColor = "Orange"; |
|
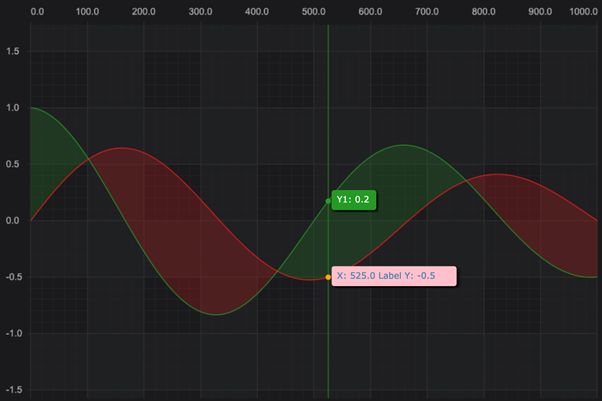
Results in:
Customizing the Tooltip Content
The Tooltip Content can be customised in the RolloverModifier. There are two levels of this. You can customise just the content for the tooltip, or you can supply your own svg to customise the appearance as well.
To customise the content, create a tooltipDataTemplate. This is a function which takes a seriesInfo (which is the results of the hit-test) and returns an array of strings which are the lines that will appear in the tooltip.
| Tooltip Content |
Copy Code
|
|---|---|
    const tooltipDataTemplate: TRolloverTooltipDataTemplate = (seriesInfo: XySeriesInfo): string[] => {
        const valuesWithLabels: string[] = [];
        // Line Series
        const xySeriesInfo = seriesInfo as XySeriesInfo;
        valuesWithLabels.push(`X: ${xySeriesInfo.formattedXValue} Y: ${xySeriesInfo.formattedYValue}`);
        return valuesWithLabels;
    };
|
|
You can apply this template function to the rolloverModifier itself, in which case it will apply to all series, or you can set it per-series using renderableSeries.rolloverModifierProps.tooltipDataTemplate = tooltipDataTemplate;
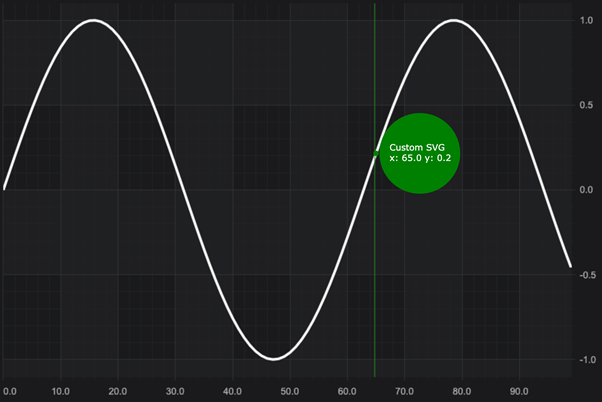
To change the shape and layout of the tooltip, you can create an SVG element to be hosted inside the tooltip:
| Styling the Tooltip |
Copy Code
|
|---|---|
const lineSeries = new FastLineRenderableSeries(wasmContext, { stroke: EColor.Orange }); lineSeries.rolloverModifierProps.tooltipTemplate = ( id: string, tooltipProps: RolloverModifierRenderableSeriesProps, seriesInfo: SeriesInfo, updateSize: (width: number, height: number) => void ) => { const { tooltipTitle, tooltipColor, tooltipTextColor } = tooltipProps; const width = 120; const height = 120; updateSize(width, height); return `<svg width="${width}" height="${height}"> <circle cx="50%" cy="50%" r="50%" fill="${tooltipColor}"/> <svg width="100%"> <text y="40" font-size="13" font-family="Verdana" dy="0" fill="${tooltipTextColor}"> <tspan x="15" dy="1.2em">${tooltipTitle}</tspan> <tspan x="15" dy="1.2em">x: ${seriesInfo.formattedXValue} y: ${seriesInfo.formattedYValue}</tspan> </text> </svg> </svg>`; }; |
|
This results in the following output:
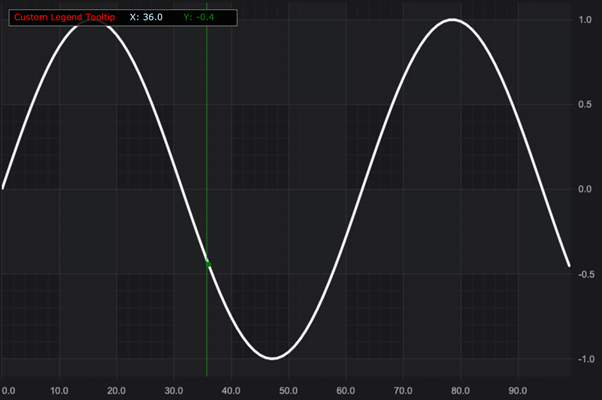
Consuming Tooltip Data in a Legend
Rollover data can also be consumed in a custom legend in the top-left of the chart. Try some code like this:
| Styling the Tooltip |
Copy Code
|
|---|---|
const lineSeries = new FastLineRenderableSeries(wasmContext, { stroke: EColor.Orange }); lineSeries.rolloverModifierProps.tooltipLegendTemplate = ( tooltipProps: RolloverModifierRenderableSeriesProps, seriesInfo: SeriesInfo ) => { return `<svg width="340" height="25"> <rect width="100%" height="100%" fill="#000000DD" stroke="grey" stroke-width="2" /> <svg width="100%"> <text x="8" y="16" font-size="13" font-family="Verdana" fill="red">Custom Legend Tooltip</text> <text x="180" y="16" font-size="13" font-family="Verdana" fill="lightblue">X: ${seriesInfo.formattedXValue}</text> <text x="260" y="16" font-size="13" font-family="Verdana" fill="green">Y: ${seriesInfo.formattedYValue}</text> </svg> </svg>`; }; |
|
This results in the following active-legend which updates as you move the mouse over the chart.
Getting tooltips for the nearest point only
By default, RolloverModifier returns data for all series at the x-value the mouse is over, regardless of y-value. If you want to only see information for the points that are near the cursor in both x and y, then set the hitTestRadius property to a non-zero value, either on the modifier instance, or in the constructor options. This will cause it to report only on points that number of pixels away from the cursor.