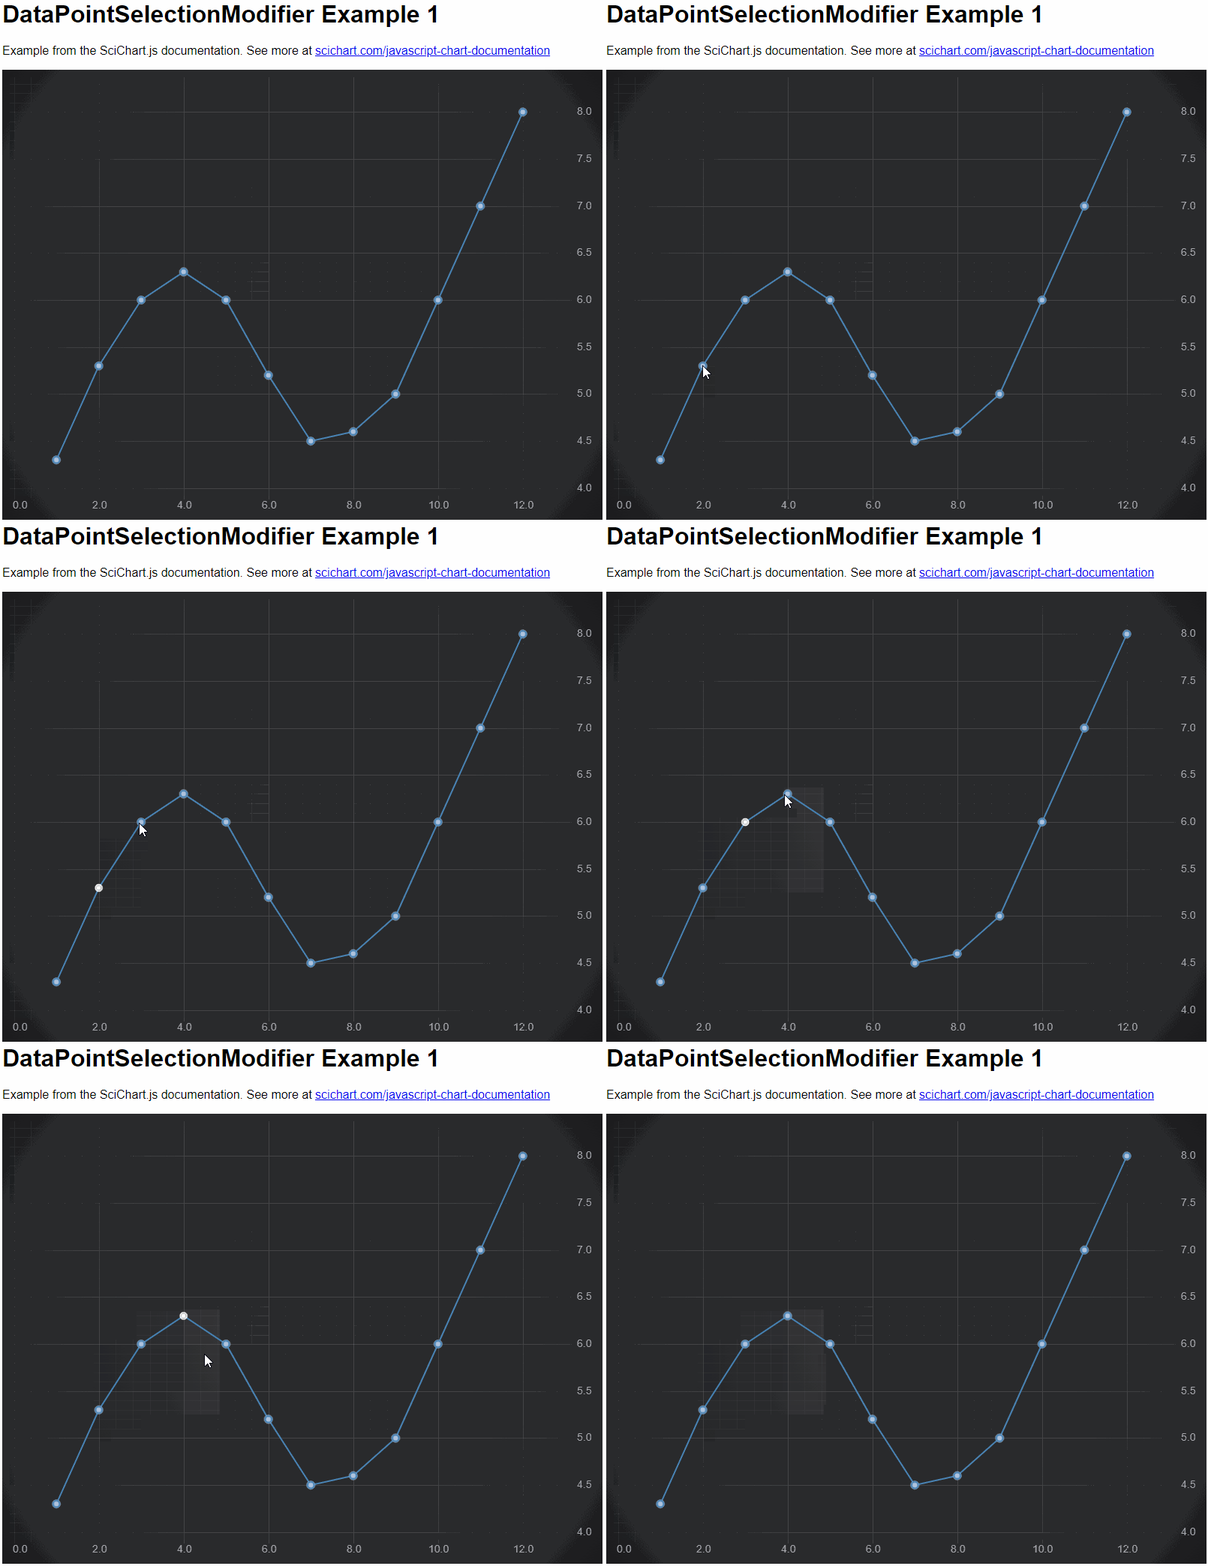
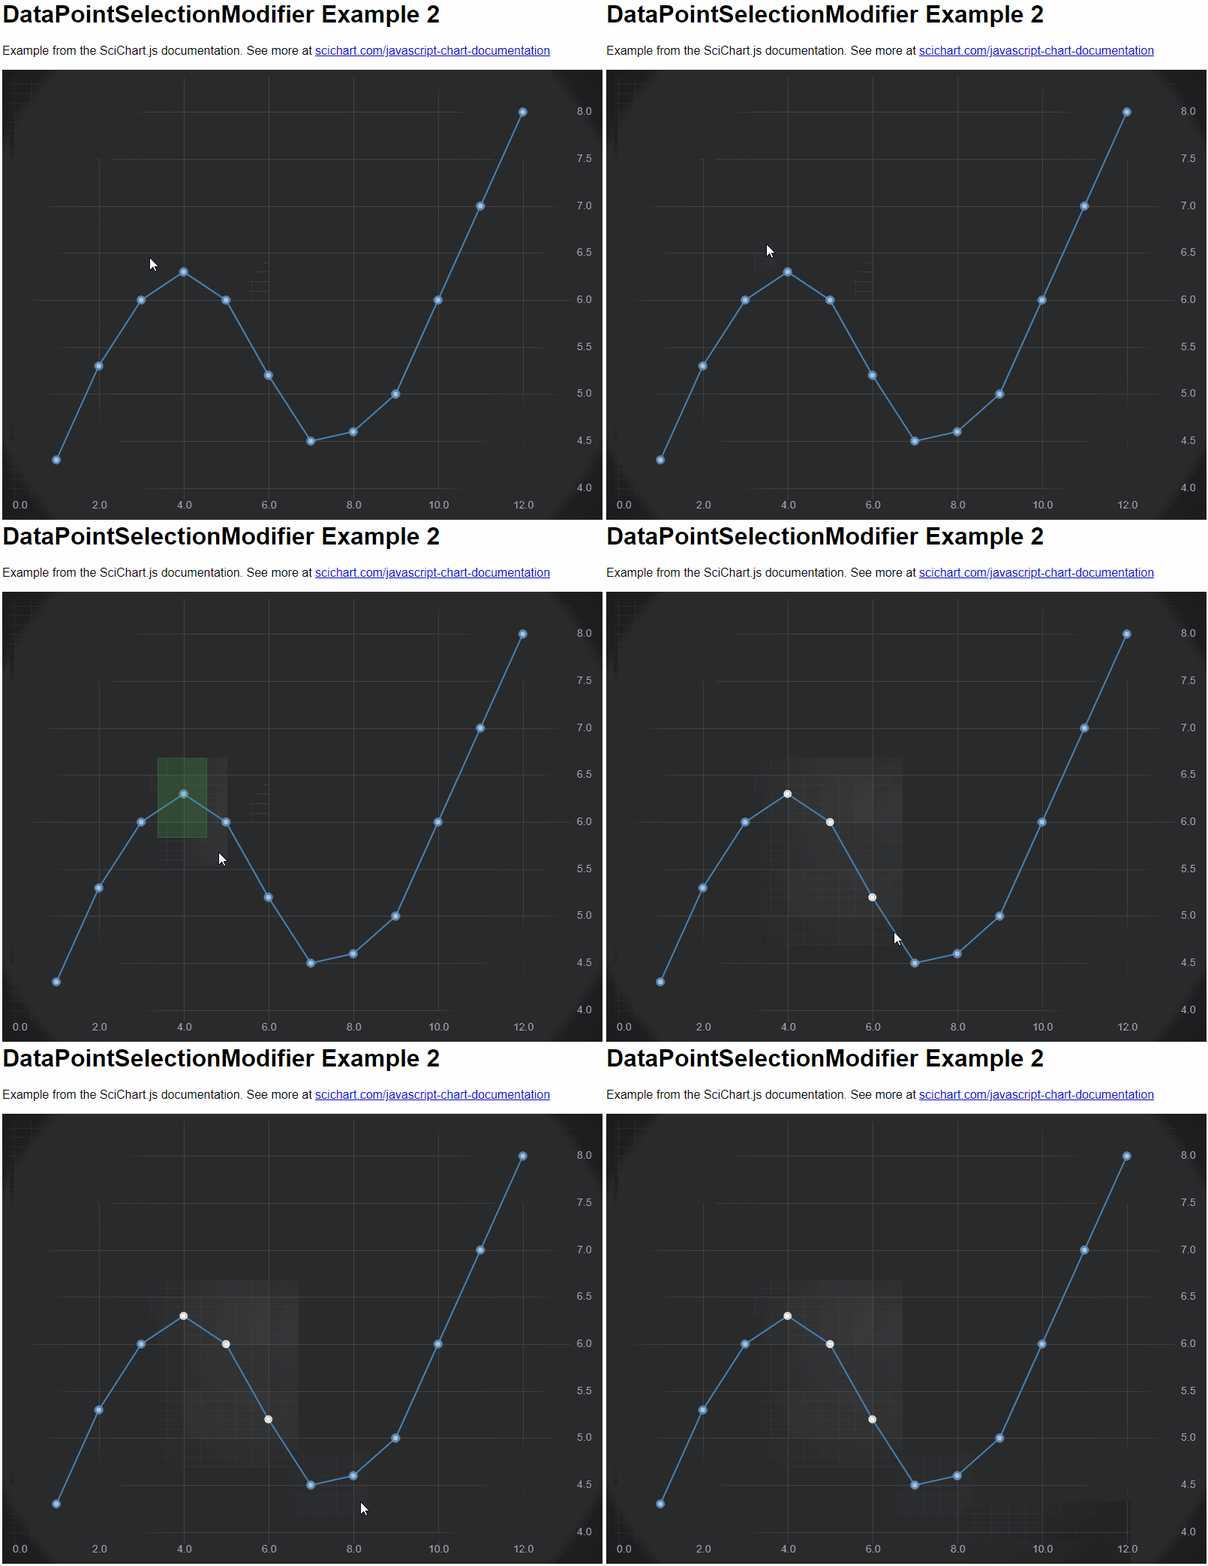
SciChart now features a native ChartModifier called the DataPointSelectionModifier which allows individual data-points to be selected via the mouse, or programmatically.
The DataPointSelectionModifier allows you to do two things:
- Be notified via the onSelectionChanged event when the user selects one or more points.
- Change the rendering of the selected points using a PaletteProvider
Enabling the DataPointSelectionModifier
To enable Data-point selection, you must do the following:
- Add a DataPointSelectionModifier to the SciChartSurface.chartModifier collection
- (Optional) Create and add IPointMetadata for each data-point you wish to programmatically select. If you do not do this, DataPointSelectionModifier will do it for you.
- (Optional) Add a DataPointSelectionPaletteProvider to series if you want visual feedback on selection. If you do not do this, points will be selected but without visual feedback.
Find an example below
| DataPointSelectionModifier |
Copy Code
|
|---|---|
import {SciChartSurface} from "scichart/Charting/Visuals/SciChartSurface";
import {NumericAxis} from "scichart/Charting/Visuals/Axis/NumericAxis";
import {EllipsePointMarker} from "scichart/Charting/Visuals/PointMarkers/EllipsePointMarker";
import {XyDataSeries} from "scichart/Charting/Model/XyDataSeries";
import {DataPointSelectionModifier } from "scichart/Charting/ChartModifiers/DataPointSelectionModifier";
import {DataPointSelectionPaletteProvider} from "scichart/Charting/Model/DataPointSelectionPaletteProvider";
import {FastLineRenderableSeries} from "scichart/Charting/Visuals/RenderableSeries/FastLineRenderableSeries";
import {NumberRange} from "scichart/Core/NumberRange";
export async function datapointSelectionExample1() {
    const { sciChartSurface, wasmContext } = await SciChartSurface.create("scichart-div-id");
    sciChartSurface.xAxes.add(new NumericAxis(wasmContext, { growBy: new NumberRange(0.1, 0.1) }));
    sciChartSurface.yAxes.add(new NumericAxis(wasmContext, { growBy: new NumberRange(0.1, 0.1) }));
    // Create a chart with line series with a point-marker
    sciChartSurface.renderableSeries.add(new FastLineRenderableSeries(wasmContext, {
        stroke: "SteelBlue",
        strokeThickness: 3,
        pointMarker: new EllipsePointMarker(wasmContext, {
            width: 10,
            height: 10,
            strokeThickness: 2,
            stroke: "SteelBlue",
            fill: "LightSteelBlue"}),
        dataSeries: new XyDataSeries(wasmContext, {
            xValues: [1, 2, 3, 4, 5, 6, 7, 8, 9, 10, 11, 12],
            yValues: [4.3, 5.3, 6, 6.3, 6, 5.2, 4.5, 4.6, 5, 6, 7, 8]
        }),
        // Adding the DataPointSelectionPaletteProvider will change the fill/stroke of the pointmarker on selection
        paletteProvider: new DataPointSelectionPaletteProvider({ fill: "white", stroke: "white" })
    }));
    // Add the DatapointSelectionModifier to the chart
    sciChartSurface.chartModifiers.add(new DataPointSelectionModifier());
}
|
|

Getting Notifications on Datapoint Selection
The DataPointSelectionModifier has an event, selectionChanged, which allows you to subscribe to a callback when points are selected or deselected. The onSelectionChanged function may also be passed into the constructor options.
Here are two ways you can be notified when datapoint selection changes in SciChart.
| DataPointSelectionModifier |
Copy Code
|
|---|---|
import { DataPointSelectionModifier } from "scichart/Charting/ChartModifiers/DataPointSelectionModifier";

// Option 1, pass onSelectionChanged callback when creating the DataPointSelectionModifier
sciChartSurface.chartModifiers.add(new DataPointSelectionModifier({
    onSelectionChanged: (args) => {
        console.log(`${args.selectedDataPoints.length} datapoints selected!`);
    }
}));

// Option 2, multiple subscribers can listen to the selectionChanged event as well
const dataPointSelectionModifier = new DataPointSelectionModifier();
dataPointSelectionModifier.selectionChanged.subscribe((args) => {
        console.log(`${args.selectedDataPoints.length} datapoints selected!`);
});
|
|
For more info about the arguments to the selectionChanged event or onSelectionChanged callback, please see the following items in our TypeDoc documentation.
- DataPointSelectionModifier.selectChanged event
- DataPointSelectionChangedArgs type
- DataPointInfo type
Multi-select, Invert-selection and Replace-selection
The DataPointSelectionModifier supports multi-selection by holding the CTRL key while clicking on datapoints. This option is available when DataPointSelectionModifier.allowClickSelect = true.
Holding the SHIFT key inverts a selection. Use this to deselect a single point on the chart.
Without CTRL or SHIFT pressed, the default behaviour is to replace a selection, e.g. a new point clicked will replace a previously clicked point.
To customize this behaviour you can pass a getSelectionMode function into the constructor options of DataPointSelectionModifier, or, override the getSelectionMode function. For example:
| Example Title |
Copy Code
|
|---|---|
import {DataPointSelectionModifier, ESelectionMode, TModifierKeys} from "scichart/Charting/ChartModifiers/DataPointSelectionModifier";

const dataPointSelectionModifier = new DataPointSelectionModifier({
    // Override getSelectionMode behaviour
    getSelectionMode: (modifierKeys, isAreaSelection) => {
        if (modifierKeys.ctrlKey) {
            // Union when area selection and CTRL else Inverse
            return ESelectionMode.Union;
        } else if (modifierKeys.shiftKey) {
            // When shift Inverse
            return ESelectionMode.Inverse;
        }
        // Default mode is Replace
        return ESelectionMode.Replace;
    },
});
|
|
Rectangle Select DataPoints
Datapoints may be selected by dragging a rectangle on the chart. This option is available when DataPointSelectionModifier.allowDragSelect = true.
Drag to Select rectangle can be customised by setting the properties DataPointSelectionModifier.selectionStroke, DatapointSelectionModifier.selectionFill and DataPointSelectionModifier.selectionStrokeThickness properties. This may also be customizable in the themes by setting IThemeProvider.rubberBandFillBrush and IThemeProvider.rubberBandStrokeBrush properties.
Multi-select behaviour is also configurable via the getSelectionMode function.

Customizing the Visual of Datapoint Selection
By default there is no visual feedback that a datapoint is selected or deselected. To add this behaviour, you can add a PaletteProvider to each series you want to show visual feedback. We've created one out of the box for you to simplify this process.
| DataPointSelectionModifier |
Copy Code
|
|---|---|
// Create a chart with line series with a point-marker sciChartSurface.renderableSeries.add(new FastLineRenderableSeries(wasmContext, { stroke: "SteelBlue", strokeThickness: 3, pointMarker: new EllipsePointMarker(wasmContext, { width: 10, height: 10, strokeThickness: 2, stroke: "SteelBlue", fill: "LightSteelBlue"}), dataSeries: new XyDataSeries(wasmContext, { xValues: [1, 2, 3, 4, 5, 6, 7, 8, 9, 10, 11, 12], yValues: [4.3, 5.3, 6, 6.3, 6, 5.2, 4.5, 4.6, 5, 6, 7, 8] }), // Adding the DataPointSelectionPaletteProvider will change the fill/stroke of the pointmarker on selection paletteProvider: new DataPointSelectionPaletteProvider({ fill: "white", stroke: "white" }) })); |
|
The DataPointSelectionPaletteProvider checks for IPointMetadata.isSelected to return a fill/stroke for point-markers that are selected. Our implementation looks like this. You can either use our default implementation or create your own based on this.
| DataPointSelectionPaletteProvider |
Copy Code
|
|---|---|
import { TPalletProviderDefinition } from "../../Builder/buildSeries";
import { EPaletteProviderType } from "../../types/PaletteProviderType";
import { parseArgbToHtmlColor, parseColorToUIntArgb } from "../../utils/parseColor";
import { IRenderableSeries } from "../Visuals/RenderableSeries/IRenderableSeries";
import {
    EFillPaletteMode,
    EStrokePaletteMode,
    IFillPaletteProvider,
    IPointMarkerPaletteProvider,
    IStrokePaletteProvider,
    TPointMarkerArgb
} from "./IPaletteProvider";
import { IPointMetadata } from "./IPointMetadata";

export interface ISelectedPointOptions {
    /**
     * The fill of the point-marker as an HTML color code
     */
    fill?: string;
    /**
     * The stroke of the point-marker as an HTML color code
     */
    stroke?: string;
}

export class DataPointSelectionPaletteProvider implements IPointMarkerPaletteProvider {
    public selectedPointMarker: TPointMarkerArgb;
    public selectedStroke: number;
    public selectedFill: number;
    public strokePaletteMode: EStrokePaletteMode = EStrokePaletteMode.SOLID;
    public fillPaletteMode: EFillPaletteMode = EFillPaletteMode.SOLID;
    constructor(options: ISelectedPointOptions) {
        if (options?.stroke) {
            this.selectedStroke = parseColorToUIntArgb(options?.stroke);
        }
        if (options?.fill) {
            this.selectedFill = parseColorToUIntArgb(options?.fill);
        }
        this.selectedPointMarker = { stroke: this.selectedStroke, fill: this.selectedFill };
    }
    public onAttached(parentSeries: IRenderableSeries): void {}
    public onDetached(): void {}
    public overridePointMarkerArgb(
        xValue: number,
        yValue: number,
        index: number,
        opacity?: number,
        metadata?: IPointMetadata
    ): TPointMarkerArgb {
        if (metadata?.isSelected) {
            return this.selectedPointMarker;
        }
        return undefined;
    }
}
|
|
Programmatically Selecting Points
If you want to select or deselect datapoints in code, you can do this through the IPointMetadata.isSelected property. After setting this property don't forget to call sciChartSurface.invalidateElement() to force a redraw of the chart!
| DataPointSelectionPaletteProvider |
Copy Code
|
|---|---|
// Create a DataSeries with x,y values and metadata const dataSeries = new XyDataSeries(wasmContext, { xValues: [1, 2, 3, 4, 5, 6, 7, 8, 9, 10, 11, 12], yValues: [4.3, 5.3, 6, 6.3, 6, 5.2, 4.5, 4.6, 5, 6, 7, 8], metadata: [{ isSelected: false }, { isSelected: false }, { isSelected: false }, { isSelected: false }, { isSelected: false }, { isSelected: false }, { isSelected: false }, { isSelected: false }, { isSelected: false }, { isSelected: false }, { isSelected: false }, { isSelected: false }] }); // Now set isSelected programmatically on some datapoints dataSeries.getMetadataAt(3).isSelected = true; dataSeries.getMetadataAt(4).isSelected = true; |
|
This code will programmatically set all points to deselected, except for points at index 3 and 4.
