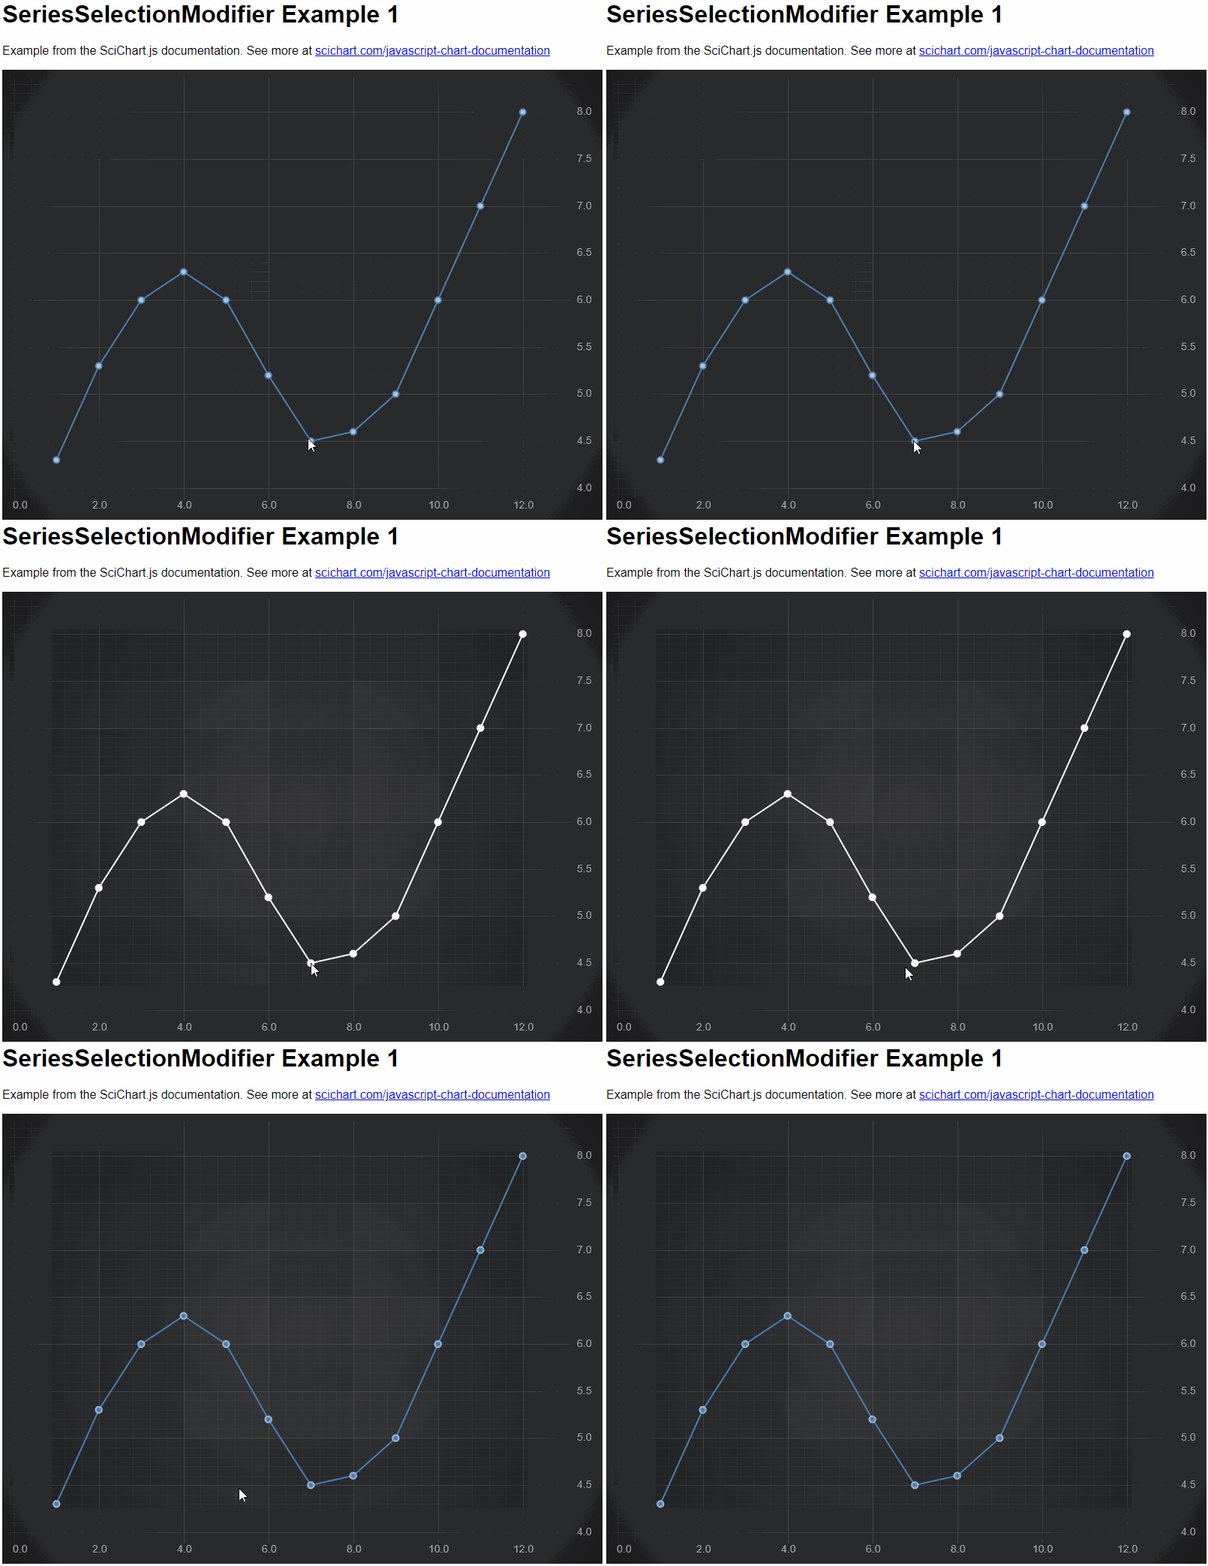
SciChart now features a native ChartModifier called the SeriesSelectionModifier which allows you to click-select series via the mouse, or programmatically. The SeriesSelectionModifier allows you to do two things:
- Be notified via the selectionChanged event when the user selects one or more series.
- Be notified via the hoverChanged event when a user hovers one or more series
- Get a list of currently selected or currently hovered series
Find an example below
| SeriesSelectionModifier |
Copy Code
|
|---|---|
import {SciChartSurface} from "scichart/Charting/Visuals/SciChartSurface";
import {NumericAxis} from "scichart/Charting/Visuals/Axis/NumericAxis";
import {EllipsePointMarker} from "scichart/Charting/Visuals/PointMarkers/EllipsePointMarker";
import {XyDataSeries} from "scichart/Charting/Model/XyDataSeries";
import {SeriesSelectionModifier } from "scichart/Charting/ChartModifiers/SeriesSelectionModifier";
import {FastLineRenderableSeries} from "scichart/Charting/Visuals/RenderableSeries/FastLineRenderableSeries";
import {NumberRange} from "scichart/Core/NumberRange";
async function initSciChart() {
    const { sciChartSurface, wasmContext } = await SciChartSurface.create("scichart-div-id");
    sciChartSurface.xAxes.add(new NumericAxis(wasmContext, { growBy: new NumberRange(0.1, 0.1) }));
    sciChartSurface.yAxes.add(new NumericAxis(wasmContext, { growBy: new NumberRange(0.1, 0.1) }));
    // Create a chart with line series with a point-marker
    // Subscribe to onSelected to change the visual of the series when isSelected = true
    sciChartSurface.renderableSeries.add(new FastLineRenderableSeries(wasmContext, {
        stroke: "SteelBlue",
        strokeThickness: 3,
        pointMarker: new EllipsePointMarker(wasmContext, {
            width: 10,
            height: 10,
            strokeThickness: 2,
            stroke: "SteelBlue",
            fill: "LightSteelBlue"}),
        dataSeries: new XyDataSeries(wasmContext, {
            xValues: [1, 2, 3, 4, 5, 6, 7, 8, 9, 10, 11, 12],
            yValues: [4.3, 5.3, 6, 6.3, 6, 5.2, 4.5, 4.6, 5, 6, 7, 8]
        }),
        // using onSelectedChanged callback, change the style of the series on selection
        onSelectedChanged: sourceSeries => {
            sourceSeries.stroke = sourceSeries.isSelected ? "white" : "SteelBlue";
            sourceSeries.pointMarker.fill = sourceSeries.isSelected ? "white" : "SteelBlue";
            sourceSeries.pointMarker.stroke = sourceSeries.isSelected ? "white" : "LightSteelBlue";
        }
    }));
    // Add the DatapointSelectionModifier to the chart
    sciChartSurface.chartModifiers.add(new SeriesSelectionModifier());
}
initSciChart();
|
|

Getting Notified on Series Hovered / Selected
The SeriesSelectionModifier has two events: SeriesSelectionModifier.selectionChanged and SeriesSelectionModifier.hoverChanged. These provide callbacks to user code when a series is selected or deselected.
The constructor options for the SeriesSelectionModifier also have onSelectionChanged and onHoverChanged functions.
Finally, series themselves have selected and hovered events and functions in the constructor.
Here are the four possible ways you can get notified when selection changes in SciChart.js
| SeriesSelectionModifier |
Copy Code
|
|---|---|
import {SciChartSurface} from "scichart/Charting/Visuals/SciChartSurface";
import {NumericAxis} from "scichart/Charting/Visuals/Axis/NumericAxis";
import {XyDataSeries} from "scichart/Charting/Model/XyDataSeries";
import {FastLineRenderableSeries} from "scichart/Charting/Visuals/RenderableSeries/FastLineRenderableSeries";
import {NumberRange} from "scichart/Core/NumberRange";
import {SeriesSelectionModifier} from "scichart/Charting/ChartModifiers/SeriesSelectionModifier";
async function initSciChart() {
    const { sciChartSurface, wasmContext } = await SciChartSurface.create("scichart-div-id");
    sciChartSurface.xAxes.add(new NumericAxis(wasmContext, { growBy: new NumberRange(0.1, 0.1) }));
    sciChartSurface.yAxes.add(new NumericAxis(wasmContext, { growBy: new NumberRange(0.1, 0.1) }));
    // Method 1: Pass onSelectionChanged and onHoverChanged to SeriesSelectionModifier constructor options
    const seriesSelectionModifier = new SeriesSelectionModifier( {
        enableHover: true,
        enableSelection: true,
        onSelectionChanged: (args) => {
            console.log("1 seriesSelectionModifier constructor onSelectionChanged");
        },
        onHoverChanged: (args) => {
            console.log("1 seriesSelectionModifier constructor onHoverChanged");
        }
    });
    // Method 2: Use the hoverChanged and selectionChanged events
    seriesSelectionModifier.hoverChanged.subscribe((args) => {
        console.log("2 seriesSelectionModifier.hoverChanged event");
    });
    seriesSelectionModifier.selectionChanged.subscribe((args) => {
        console.log("2 seriesSelectionModifier.selectionChanged event");
    });
    // Method 3: Use the onSelectedChanged functions on the series itself
    const series = new FastLineRenderableSeries(wasmContext, {
        stroke: "SteelBlue",
        strokeThickness: 5,
        dataSeries: new XyDataSeries(wasmContext, {
            xValues: [1, 2, 3, 4, 5, 6, 7, 8, 9, 10, 11, 12],
            yValues: [4.3, 5.3, 6, 6.3, 6, 5.2, 4.5, 4.6, 5, 6, 7, 8]
        }),
        onSelectedChanged: (sourceSeries, isSelected) => {
            console.log("3 FastLineRenderableSeries constructor onSelectedChanged");
        },
        onHoveredChanged: (sourceSeries, isHovered)  => {
            console.log("3 FastLineRenderableSeries constructor onSelectedChanged");
        }
    });
    // Method 4: use the selected and hovered events on the series
    series.hovered.subscribe((args) => {
        console.log("4 FastLineRenderableSeries.hovered event");
        series.stroke = series.isSelected ? "White" : series.isHovered ? "Orange" : "SteelBlue";
    });
    series.selected.subscribe((args) => {
        console.log("4 FastLineRenderableSeries.selected event");
        series.stroke = series.isSelected ? "White" : series.isHovered ? "Orange" : "SteelBlue";
    });
    // Add the modifier and series to chart
    sciChartSurface.chartModifiers.add(seriesSelectionModifier);
    sciChartSurface.renderableSeries.add(series);
}
initSciChart();
|
|
Customizing Selection Visuals
Colour a series when selected
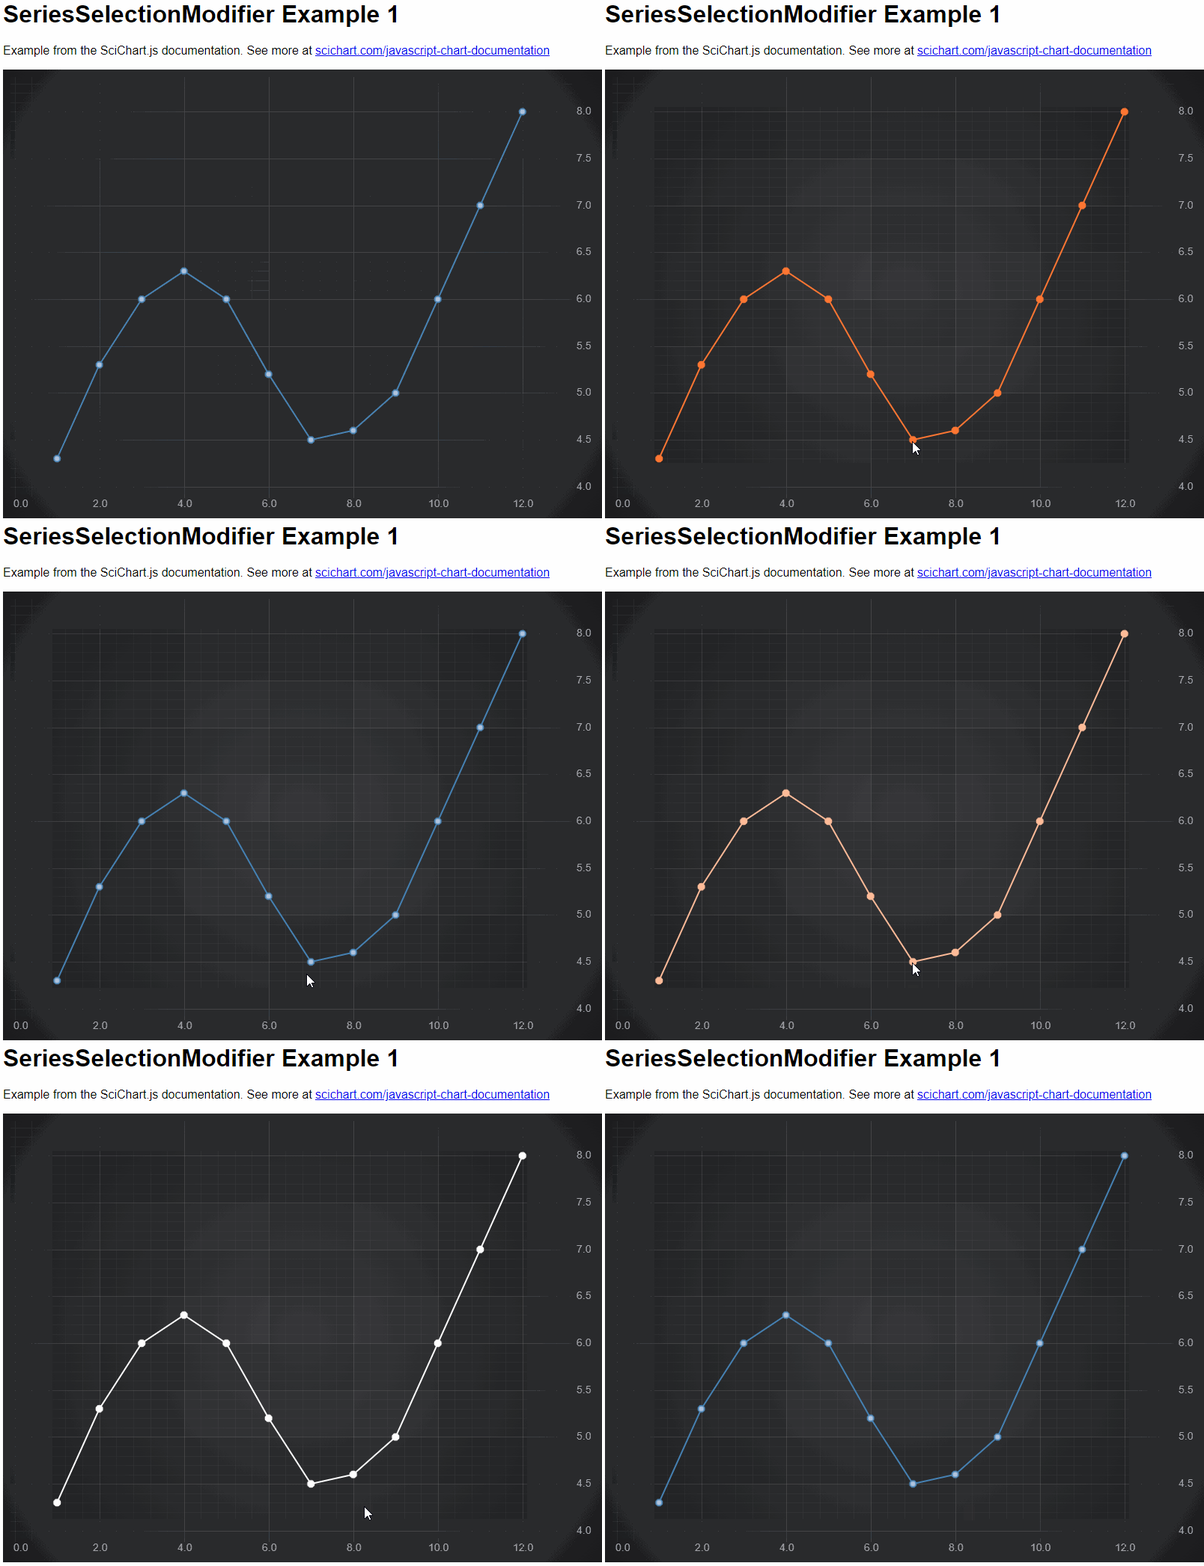
When a series is selected or hovered, you can use one of the callback methods (above) to change it's style. Any property may be changed, such as stroke, strokeThickness, pointMarker type or colours. Below is a simple code sample showing how to get a tri-state style on series selected, hovered, or selected and hovered.
| SeriesSelectionModifier |
Copy Code
|
|---|---|
import {SciChartSurface} from "scichart/Charting/Visuals/SciChartSurface";
import {NumericAxis} from "scichart/Charting/Visuals/Axis/NumericAxis";
import {EllipsePointMarker} from "scichart/Charting/Visuals/PointMarkers/EllipsePointMarker";
import {XyDataSeries} from "scichart/Charting/Model/XyDataSeries";
import {FastLineRenderableSeries} from "scichart/Charting/Visuals/RenderableSeries/FastLineRenderableSeries";
import {NumberRange} from "scichart/Core/NumberRange";
import {SeriesSelectionModifier} from "scichart/Charting/ChartModifiers/SeriesSelectionModifier";
import {LineAnimation} from "scichart/Charting/Visuals/RenderableSeries/Animations/LineAnimation";
import {easing} from "scichart/Core/Animations/EasingFunctions";
async function initSciChart() {
    const { sciChartSurface, wasmContext } = await SciChartSurface.create("scichart-div-id");
    sciChartSurface.xAxes.add(new NumericAxis(wasmContext, { growBy: new NumberRange(0.1, 0.1) }));
    sciChartSurface.yAxes.add(new NumericAxis(wasmContext, { growBy: new NumberRange(0.1, 0.1) }));
    const defaultStroke = "SteelBlue";
    const defaultFill = "LightSteelBlue";
    const applyStyle = (series, isSelected, isHovered) => {
        series.stroke = isSelected && isHovered ? "#FFBB99" :
            isSelected ? "#FFF" :
                isHovered ? "#FF7733" :
                    defaultStroke;
        series.pointMarker.stroke = series.stroke;
        series.pointMarker.fill = isSelected && isHovered ? "#FFBB99" :
            isSelected ? "#FFF" :
                isHovered ? "#FF7733" :
                    defaultFill;
    };
    // Create a chart with line series with a point-marker
    sciChartSurface.renderableSeries.add(new FastLineRenderableSeries(wasmContext, {
        stroke: defaultStroke,
        strokeThickness: 3,
        pointMarker: new EllipsePointMarker(wasmContext, {
            width: 10,
            height: 10,
            strokeThickness: 2,
            stroke: defaultStroke,
            fill: defaultFill}),
        dataSeries: new XyDataSeries(wasmContext, {
            xValues: [1, 2, 3, 4, 5, 6, 7, 8, 9, 10, 11, 12],
            yValues: [4.3, 5.3, 6, 6.3, 6, 5.2, 4.5, 4.6, 5, 6, 7, 8]
        }),
        // Apply a style to the series on selected and hovered
        onSelectedChanged: sourceSeries => {
            applyStyle(sourceSeries, sourceSeries.isSelected, sourceSeries.isHovered);
        },
        onHoveredChanged: sourceSeries => {
            applyStyle(sourceSeries, sourceSeries.isSelected, sourceSeries.isHovered);
        }
    }));
    // Add the DatapointSelectionModifier to the chart
    sciChartSurface.chartModifiers.add(new SeriesSelectionModifier( {
        enableSelection: true,
        enableHover: true,
    }));
}
initSciChart();
|
|
This results in the following behaviour when hovering or selecting the series.

Animating Selection State Changes
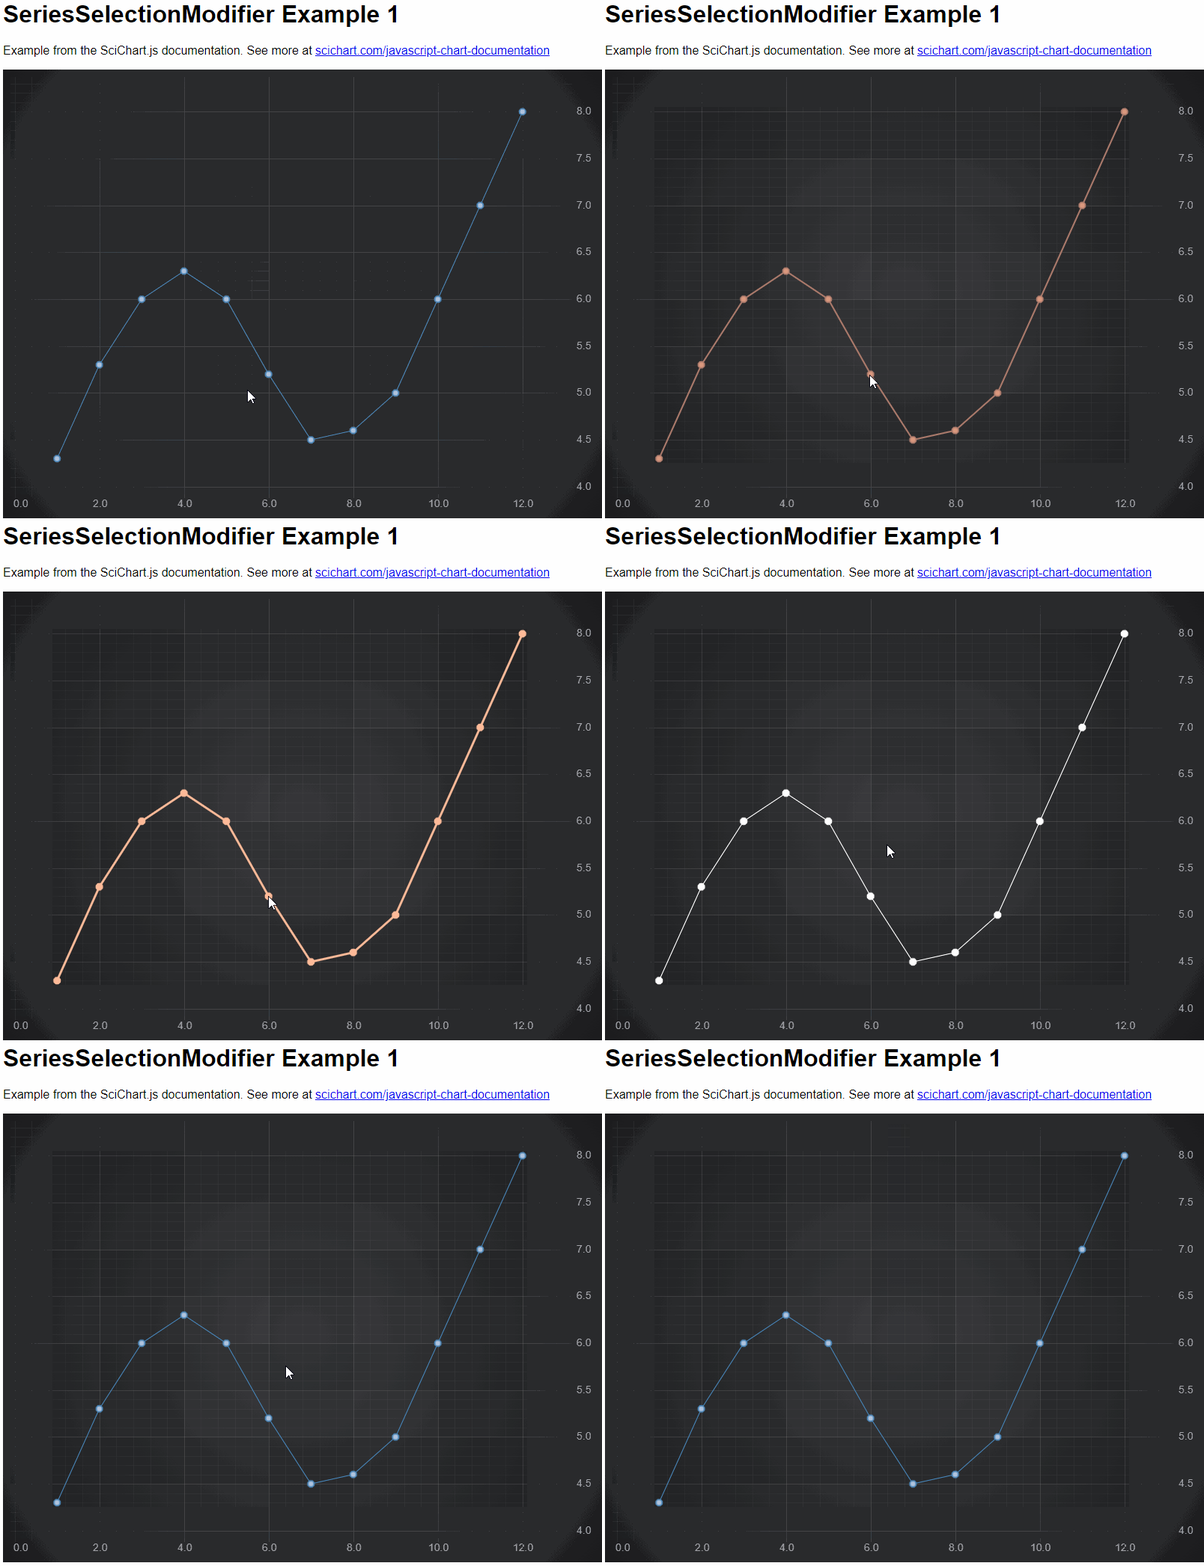
Using the Animations API built into SciChart, it is also possible to animate between style state changes on a RenderableSeries.
Update the code above to use the Animations API to call BaseRenderableSeries.enqueueAnimation as follows:
| SeriesSelectionModifier |
Copy Code
|
|---|---|
import {LineAnimation} from "scichart/Charting/Visuals/RenderableSeries/Animations/LineAnimation";
import {easing} from "scichart/Core/Animations/EasingFunctions";
import {EPointMarkerType} from "scichart/types/PointMarkerType";

// Update function applyStyle to use Animations API
const applyStyle = (series, isSelected, isHovered) => {
    const stroke = isSelected && isHovered ? "#FFBB99" :
        isSelected ? "#FFF" :
            isHovered ? "#FF7733" :
                defaultStroke;
    const fill = isSelected && isHovered ? "#FFBB99" :
        isSelected ? "#FFF" :
            isHovered ? "#FF7733" :
                defaultFill;
    const strokeThickness = isHovered ? 4 : 2;
    series.enqueueAnimation(new LineAnimation({
        styles: {
            stroke,
            strokeThickness,
            pointMarker: {
                stroke,
                fill,
                width: 10,
                height: 10,
                strokeThickness: 2,
                type: EPointMarkerType.Ellipse
             }
        },
        duration: 250,
        ease: easing.outQuad
    }));
};
|
|
This now results in the following animated style-transition behaviour when hovering or selecting the series.

Programmatically Getting/Setting Selected Series
Series may also be selected and deselected programmatically. Simply set the BaseRenderableSeries.isSelected property to trigger this action. SciChart will automatically redraw, and selectedChanged callbacks will be called, where you can update the style.
