
This set of tutorials will be limited to how to use SciChart.js by including index.min.js in a vanilla JS application (without npm and webpack).
We recommend going through the following tutorials which explain the API first.
... and more
Including SciChart.js in an HTML Page using CDN
The following tutorial shows you how to include SciChart.js in an HTML page via a CDN, without the need for setup of npm and a module bundler such as webpack.
This methods is suitable for users who have JavaScript applications but still want to use SciChart.js to show charts & graphs in their applications.
This method is also useful as a fallback in application frameworks like Blazor, which don't have Npm support but do need to interop with JavaScript charts in a webpage.
How to add SciChart index.min.js to your project
- Add a crossorigin anonymous script with src equal to https://cdn.jsdelivr.net/npm/scichart/index.min.js. For instance to add the latest version add this script:
Include SciChart.js Script Copy Code<script src="https://cdn.jsdelivr.net/npm/scichart/index.min.js" crossorigin="anonymous" ></script> - You can if you wish, include a specific version of SciChart by using this syntax. Major/minor versions may also be included by following guidance from https://www.jsdelivr.com/package/npm/scichart.
Include SciChart.js Script Copy Code<script src="https://cdn.jsdelivr.net/npm/scichart@3.5.782/index.min.js" crossorigin="anonymous" ></script> - Next, add some series, axis and behaviours to the SciChartSurface (more on that below)
Worked Example of Creating a Simple Line Chart using index.min.js
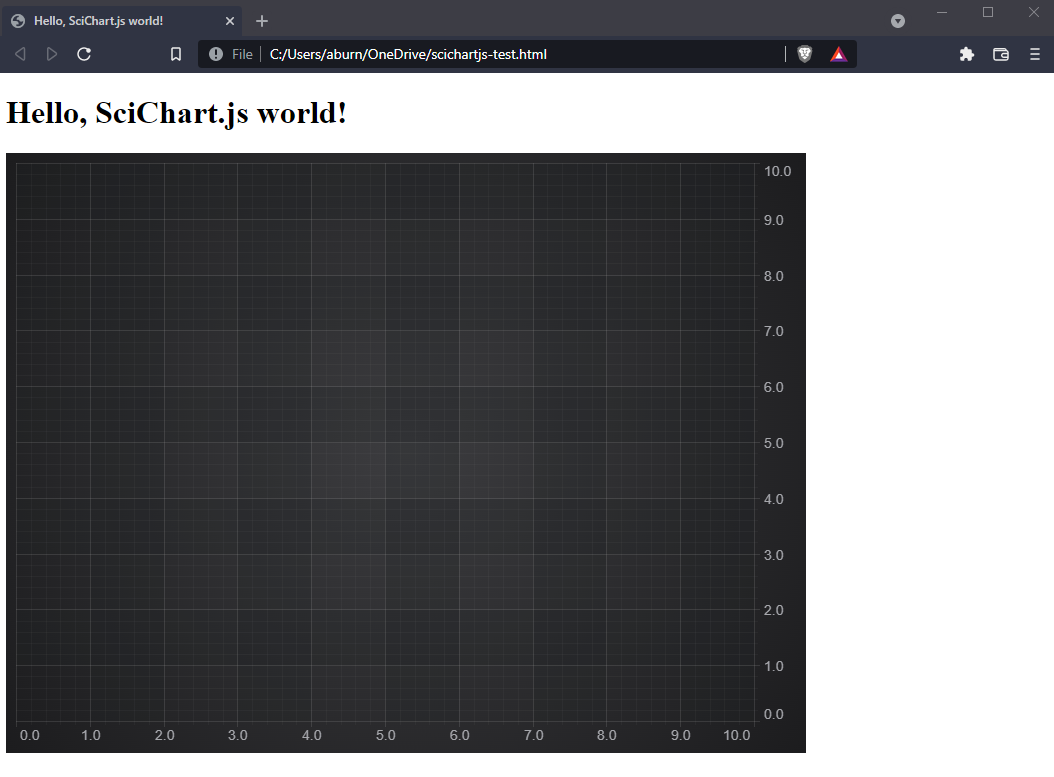
We have a worked example over at Github of how to use this, but for the sake of ease let's include the code below.
This results in the following output:
Breaking the Code Down
- We included the <script> tag to load index.min.js with a specific version
- We have an async function to setup SciChart. This is necessary because SciChart itself uses async functions to load, and we don't want to block the browser loading.
- Inside this async function, we call SciChartSurface.create() to instantiate a chart surface. This function must be awaited.
- Lastly, we can use the SciChart API to add a X and Y Axis and series with some data.
When using index.min.js all types are global variables. Use const{ SciChartSurface, NumericAxis ..} = SciChart;
How the Wasm Files get Initialized
If you've watched our Tutorial 01 - Setting up an npm project with WebPack, you will have read about wasm/data (WebAssembly) files which must be served to load the chart.
SciChart.js when served from CDN automatically defaults to load the wasm from CDN as well. Implicity the following line of code is called.
It's important to note when initializing SciChart.js from CDN that the wasm/data files will also be loaded from CDN. So your application will require an internet connection to work.
If you want to host the index.min.js and wasm files locally, then they must be downloaded and included in your app. Read Tutorial 02 - Including index.min.js and WebAssembly Files offline to find out how.
Further details on Wasm file deployment can also be found here.
Further Notes
A Note on Licensing SciChart.
The SciChart.js control comes with a community license which is watermarked. This can be used for commercial trial use for a reasonable time period.
For commercial licenses, a license key can be applied following the instructions at www.scichart.com/licensing-scichart-js.