
One of the challenges when creating a chart with multiple series is picking colours for each series, especially when you are trying to keep to a color scheme. We faced this problem during the recent rethemeing of our demos to match the new website theme. The solution was to create a way to let SciChart automatically pick colours based off a palette.
Setting up Auto Coloring
In order to use auto coloring you need to set up a strokePalette and/or fillPalette on a theme and apply it to a surface. You can then set a stroke or fill color as AUTO_COLOR and those items will pick colors based on the palette. stroke properties use strokePalette and fill properties use fillPalette.
The color is picked based on the number of series currently on the chart. If the number of series is less than or equal to the number of entries in the palette, then scichart will pick values directly from the palette. If there are more series than palette entries, scichart will generate a gradient using the palette and then pick colours evenly spaced on that gradient.
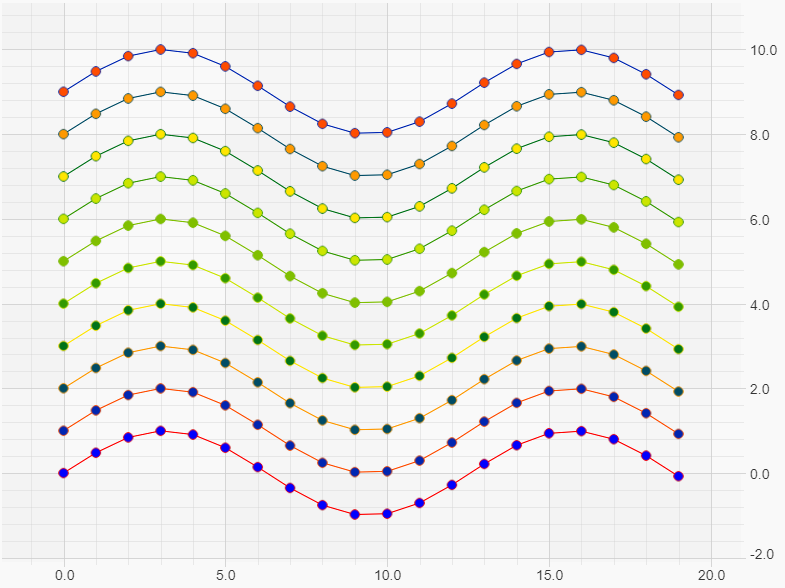
In the example below, the stroke and fill palettes are reversed.
| Auto coloring |
Copy Code
|
|---|---|
import {SciChartSurface} from "scichart/Charting/Visuals/SciChartSurface";
import {NumericAxis} from "scichart/Charting/Visuals/Axis/NumericAxis";
import {SciChartJSLightTheme} from "scichart/Charting/Themes/SciChartJSLightTheme";
import { FastLineRenderableSeries } from "scichart/Charting/Visuals/RenderableSeries/FastLineRenderableSeries";
import { AUTO_COLOR } from "scichart/Charting/Themes/IThemeProvider";
import { XyDataSeries } from "scichart/Charting/Model/XyDataSeries";
import { EllipsePointMarker } from "scichart/Charting/Visuals/PointMarkers/EllipsePointMarker"
import { NumberRange } from "scichart/Core/NumberRange";
export async function autoColoring(divId) {
    const theme = new SciChartJSLightTheme();
    // configure the palette on the theme
    theme.strokePalette = ["red", "yellow", "green", "blue"];
    theme.fillPalette = ["blue", "green", "yellow", "red"];
    // Create a sciChartSurface using the theme
    const { sciChartSurface, wasmContext } = await SciChartSurface.create(divId,{ theme });
    sciChartSurface.xAxes.add(new NumericAxis(wasmContext, { growBy: new NumberRange(0.1, 0.1)}));
    sciChartSurface.yAxes.add(new NumericAxis(wasmContext, { growBy: new NumberRange(0.1, 0.1)}));
    // common x values - 0 to 20
    const xValues = Array.from(Array(20)).map((_, i) => i);
    // Create 10 line series with pointmarkers
    for (let i = 0; i < 10; i++) {
        const series = new FastLineRenderableSeries(wasmContext, {
            stroke: AUTO_COLOR,
            dataSeries: new XyDataSeries(wasmContext, { xValues, yValues: xValues.map(x => Math.sin(x/2) + i)}),
            pointMarker: new EllipsePointMarker(wasmContext, {
                stroke: AUTO_COLOR,
                fill: AUTO_COLOR,
                width: 10,
                height: 10
            })
        });
        sciChartSurface.renderableSeries.add(series);
    }
}
|
|
Overriding Auto Coloring
If you need to adjust the color that has been picked, you can override the adjustAutoColor method which exists on renerableSeries and pointMarker. DataLabels also support AUTO_COLOR but for overrides there use getColor instead. See DataLabel Coloring.
adjustAutoColor receives a propertyName which is either "stroke" or "fill" along with the color generated. If we add the following code into the loop in the above example
| Adjust Auto coloring |
Copy Code
|
|---|---|
        if (i === 4) {
            series.pointMarker.adjustAutoColor = (propertyName, color) => {
                return propertyName === "fill" ? "black" : color;
            };
        }
|
|
we get this
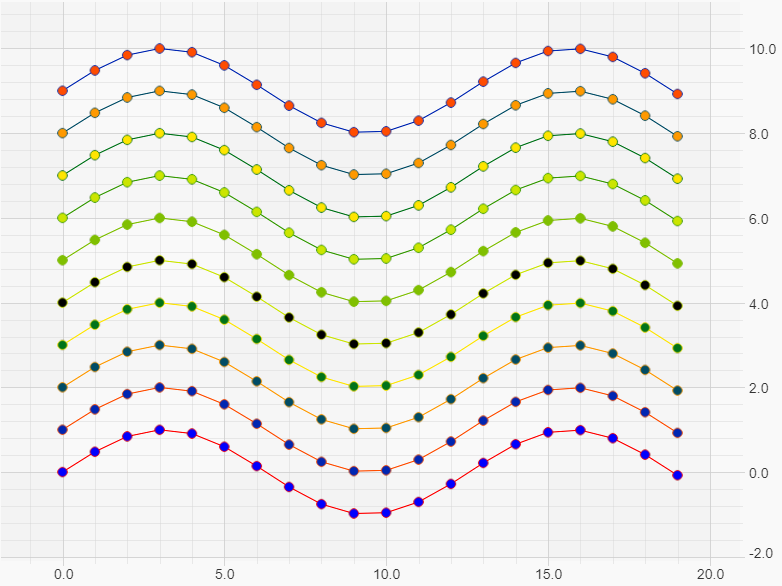
Using adjustAutoColor like this sets the color property so it no longer auto-colors. If instead you return AUTO_COLOR + "black", then it will use black for the current render, but could be updated by subsequent auto-coloring.
Controlling When Auto Coloring Occurs
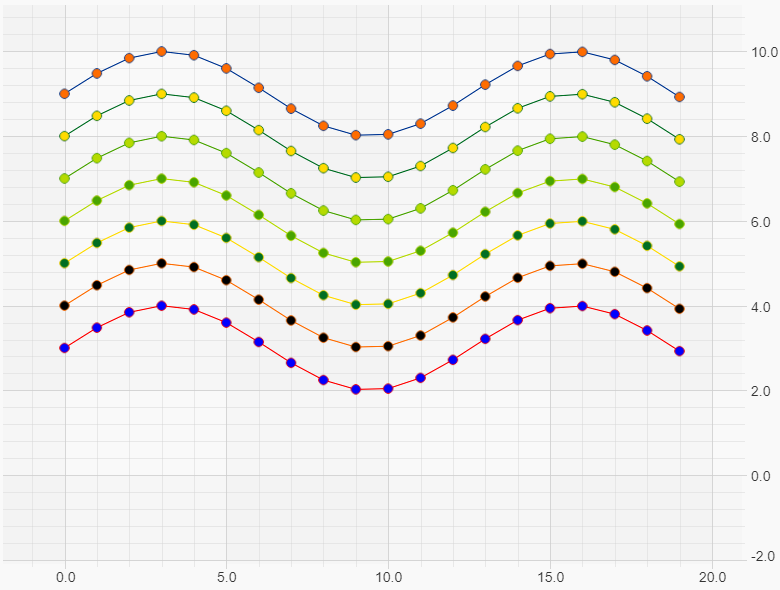
By default, colors are assigned to all series on the chart whenever a series is added or removed. If we remove the first three series after the chart has drawn, like this:
| Remove series |
Copy Code
|
|---|---|
setTimeout(() => {
        sciChartSurface.renderableSeries.removeAt(0);
        sciChartSurface.renderableSeries.removeAt(0);
        sciChartSurface.renderableSeries.removeAt(0);
    }, 1000);
|
|
Then all the series will be re-coloured using the full range of the palette. Note the black fill has not changed.
SciChartSurface has an autoColorMode property which is an EAutoColorMode. This defaults to OnAddRemoveSeries but can also be Never, Once or Always. With a fairly large number of series, Auto Coloring can potentially have a performance impact so