
In SciChart.js v3.2 we've introduced a set of Memory Leak debugging tools. Read this guide to find out how to enable Memory Leak Debugging in your app in Dev mode.
Read the setion in Memory Best Practices - Deletable Entities for background info on which types need to be explictly deleted in SciChart.js and how failure to do this can cause a memory leak.
Enabling Memory Debugging tools
Enabling memory leak debugging is possible by setting the static property MemoryUsageHelper.isMemoryUsageDebugEnabled = true.
| Example Title |
Copy Code
|
|---|---|
import { MemoryUsageHelper } from "scichart";

MemoryUsageHelper.isMemoryUsageDebugEnabled = true;
|
|
After enabling memory usage helper you should see a message in the console output like this:

Tracking Undeleted objects
Once MemoryUsageHelper is enabled, the memory usage debugging tool has two features:
- It adds helpful warnings to the JS Console when executing actions which may result in a potential memory leak or undesirable behaviour.
- It wraps objects implementing IDeletable interface and native entites created in WebAssembly into a proxy - and will keep records of them in an ObjectRegistry instance - MemoryUsageHelper.objectRegistry.
Examining the ObjectRegistry State
The registry state can be examined at any time by calling
| Example Title |
Copy Code
|
|---|---|
import { MemoryUsageHelper } from "scichart";

// Log out current objectRegistry state
MemoryUsageHelper.objectRegistry.log();
|
|
This will output several collections and their contents to the JS console. From the output we can define a lifecycle state of an object and it's type.
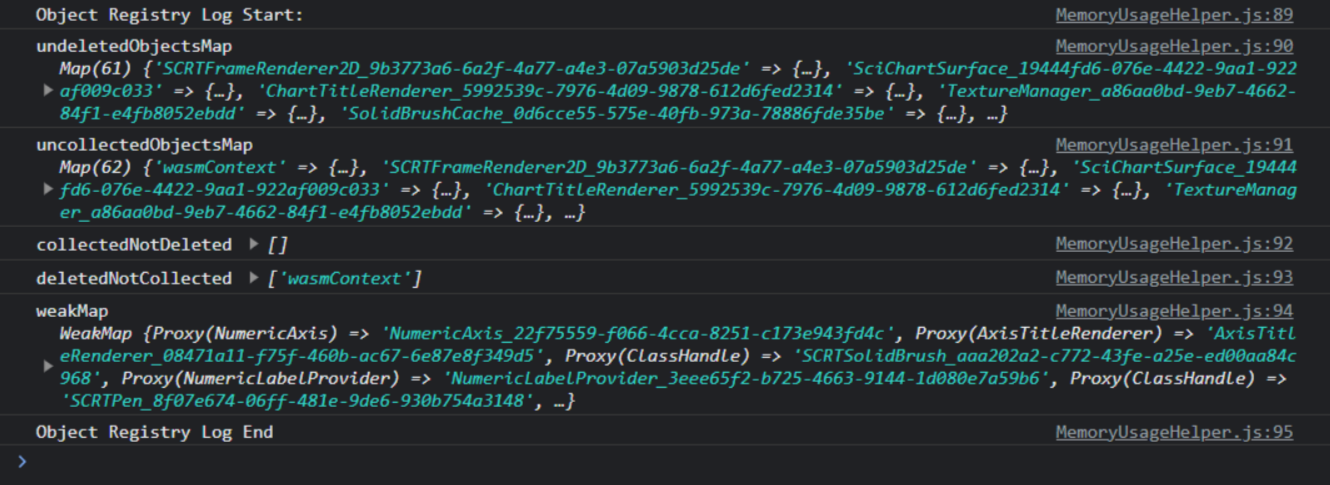
- undeletedObjectsMap - objects that were created but .delete() was not called.
- uncollectedObjectsMap = objects that are not yet garbage collected by the JavaScript Garbage Collector
- collectedNotDeleted - objects that have been garbage collected but .delete() was omitted
- deletedNotCollected - objects that had .delete() called by were not collected by the JavaScript Garbage Collector
- weakMap - another collection that could be used to see if an object was GC'd. Additionally tracks referenes to proxies of deleted objects.
What to do if you find a Leak
- deletedNotCollected: your application code called .delete() on an object but there is still a reference to it somewhere in JavaScript preventing it from being GC'd. Use the Chrome memory tools to identify the GC roots to determine the cause of the leak (find out how).
- collectedNotDeleted: your application code GC'd the object but you forgot to call .delete(). This can cause a WebAssembly memory leak. Ensure this object has .delete() called before it falls out of scope.
Tracking Arbitrary objects
MemoryUsageHelper automatically tracks all objects created within SciChart itself. If you want to use our tools to track abitrary objects in your application. you can use the following functions:
| Example Title |
Copy Code
|
|---|---|
// Register an arbitrary object MemoryUsageHelper.register(yourObject, "identifier"); // Unregister an arbitrary object MemoryUsageHelper.unregister("identifier"); |
|