SciChart.js JavaScript 2D Charts API > Subcharts API > Sub Surface Transparency
Sub Surface Transparency

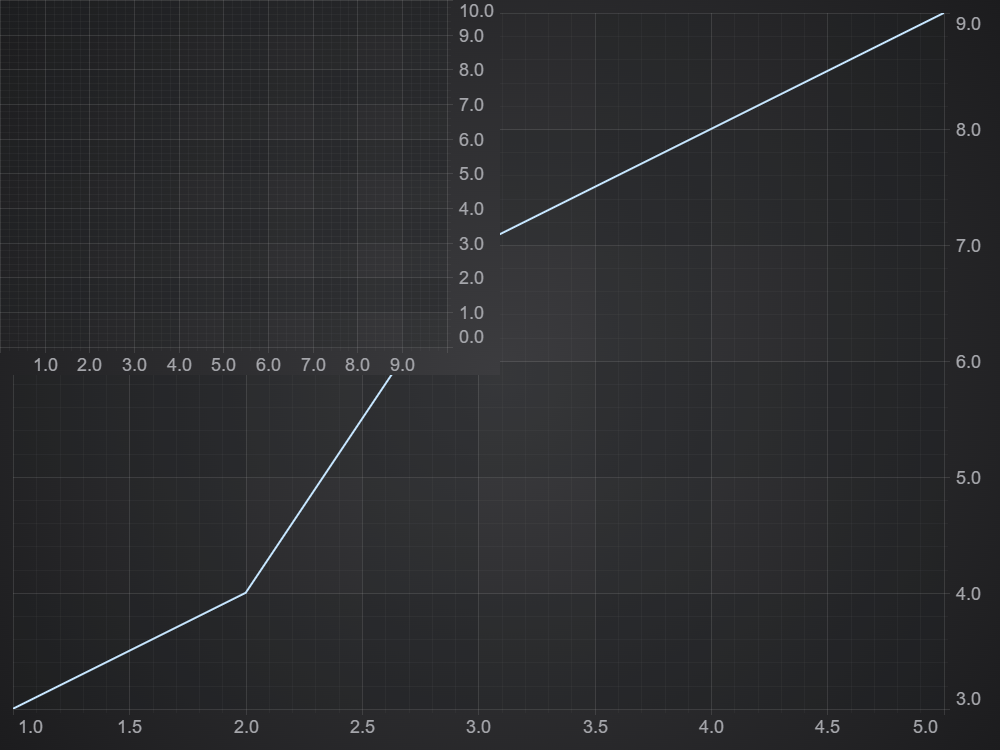
In the previous example of Setting up a Basic Subchart (chart within a chart), notice how bands and grid-lines of main chart are still visible under the sub-surface on the basic example.

Let's add a Renderable Series to the main surface of the previous example to demonstrate how sub-surface stacks with it:

import { XyDataSeries } from 'scichart/Charting/Model/XyDataSeries';
import { FastLineRenderableSeries } from 'scichart/Charting/Visuals/RenderableSeries/FastLineRenderableSeries';
// ...
// axes here are required to draw renderable series
sciChartSurface.xAxes.add(new NumericAxis(wasmContext));
sciChartSurface.yAxes.add(new NumericAxis(wasmContext));
sciChartSurface.renderableSeries.add(
    new FastLineRenderableSeries(wasmContext, {
        dataSeries: new XyDataSeries(wasmContext, {
            xValues: [1, 2, 3, 4, 5],
            yValues: [3, 4, 7, 8, 9],
        }),
    })
);
import { ESeriesType } from 'scichart/types/SeriesType';
// ...
const { wasmContext, sciChartSurface } = await chartBuilder.build2DChart(divElementId, {
    // ...
    series: {
        type: ESeriesType.LineSeries,
        xyData: {
            xValues: [1, 2, 3, 4, 5],
            yValues: [3, 4, 7, 8, 9],
        },
    },
});

This results in the following output:

IMAGE

The example shows that the Line Series will be visible underneath the sub-surface as well. This behavior could be changed using I2DSubSurfaceOptions.isTransparent option passed to SciChartSurface.addSubChart or via the SciChartSubSurface.isTransparent property.

For example, we could update our code as following:

// ...
// Add a sub-chart with non transparent background
const subChartSurface = sciChartSurface.addSubChart({
    position: new Rect(0, 0, 0.5, 0.5),
    isTransparent: false
});
import { ECoordinateMode } from 'scichart/Charting/Visuals/Annotations/AnnotationBase';
// ...
const { wasmContext, sciChartSurface } = await chartBuilder.build2DChart(divElementId, {
    // ...
    subCharts: [
        {
            surface: {
                position: new Rect(0, 0, 0.5, 0.5),
                isTransparent: false,
            },
        },
    ],
});

Which will result into the line series and grid-lines being hidden by the sub-surface.
See Also