
If you are using npm and webpack, then see our comprehensive list of Video Tutorials for SciChart.js with npm below
- Setting up an npm Project with SciChart.js
- Adding Series and Data
- Adding Zooing and Panning behaviour
... plus several more
How to add SciChart.Browser.js to your project
If you haven't seen our tutorial on how to add SciChart.js to a plain HTML page, then please first read Tutorial 01 - Including SciChart.js in an HTML page.
This shows you how to reference the browser bundle script, initialize webassembly files and create your first basic chart.
Adding Series and Data to a SciChart.js Chart
In this tutorial, we are going to add some Line series onto the chart.
First, we will add a FastLineRenderableSeries and add this to the SciChartSurface.renderableSeries collection.
Next, we create an XyDataSeries - which is the type which stores the data, and can accept dynamic updates (real-time updates) and manipulation of data. We will assign the dataseries to the FastLineRenderableSeries.
Try the code below:
| index.html |
Copy Code
|
|---|---|
<html lang="en-us"> <head> <meta charset="utf-8" /> <meta content="text/html; charset=utf-8" http-equiv="Content-Type" /> <title>SciChart.js Browser Bundle Tutorial 2</title> <script src="https://cdn.jsdelivr.net/npm/[email protected]/_wasm/scichart.browser.js" crossorigin="anonymous"></script> <script async type="text/javascript" src="index.js"></script> <style> body { font-family: 'Arial'} </style> </head> <body> <h1>Hello SciChart.js world!</h1> <p>In this example we add series & data to a SciChart Chart using pure JS and a CDN</p> <!-- the Div where the SciChartSurface will reside --> <div id="scichart-root" style="width: 800px; height: 600px;"></div> </body> </html> |
|
| index.js |
Copy Code
|
|---|---|
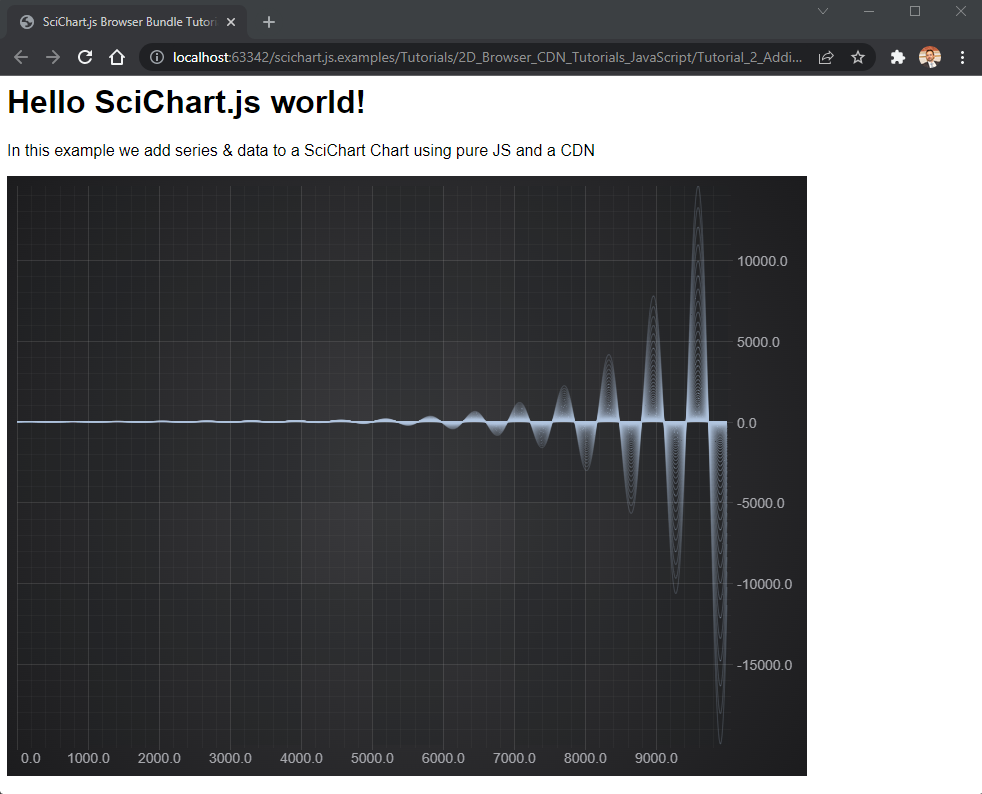
async function initSciChart() { // LICENSING // // Set your license code here. See https://www.scichart.com/licensing-scichart-js/ // for instructions // Load SciChart.js from CDN. Ensure version numbers match the script in index.html SciChart.SciChartSurface.configure({ dataUrl: `https://cdn.jsdelivr.net/npm/[email protected]${SciChart.libraryVersion}/_wasm/scichart2d.data`, wasmUrl: `https://cdn.jsdelivr.net/npm/[email protected]${SciChart.libraryVersion}/_wasm/scichart2d.wasm` }); // Create the SciChartSurface in the div 'scichart-root' // The SciChartSurface, and webassembly context 'wasmContext' are paired. This wasmContext // instance must be passed to other types that exist on the same surface. const {sciChartSurface, wasmContext} = await SciChart.SciChartSurface.create("scichart-root"); // Create an X,Y Axis and add to the chart const xAxis = new SciChart.NumericAxis(wasmContext); const yAxis = new SciChart.NumericAxis(wasmContext); sciChartSurface.xAxes.add(xAxis); sciChartSurface.yAxes.add(yAxis); // Create 100 dataseries, each with 10k points for (let seriesCount = 0; seriesCount < 100; seriesCount++) { const xyDataSeries = new SciChart.XyDataSeries(wasmContext); const opacity = (1 - ((seriesCount / 120))).toFixed(2); // Populate with some data for(let i = 0; i < 10000; i++) { xyDataSeries.append(i, Math.sin(i* 0.01) * Math.exp(i*(0.00001*(seriesCount+1)))); } // Add and create a line series with this data to the chart // Create a line series const lineSeries = new SciChart.FastLineRenderableSeries(wasmContext, { dataSeries: xyDataSeries, stroke: `rgba(176,196,222,${opacity})`, strokeThickness:2 }); sciChartSurface.renderableSeries.add(lineSeries); } } initSciChart(); |
|
This results in the following output:
Breaking the Code Down
- We included the <script> tag to load SciChart.browser.js with a specific version
- We have an async function to setup SciChart. This is necessary because SciChart itself uses async functions to load, and we don't want to block the browser loading.
- Inside this async function, we call SciChart.SciChartSurface.Configure to load data & wasm files.
- Lastly, we can use the SciChart API to create a surface, and add an X and Y Axis and add some RenderableSeries and DataSeries.
Further Learning
All of the SciChart APIs can be used in the Browser Bundle method where you include a script directly in HTML. The only difference is each type, function or class must be prefixed by the global namespace SciChart.
You can therefore use any of our examples or tutorials but prefix the type with SciChart. so that it can be loaded directly in the browser.
There is no intellisense or type discovery when using the browser bundle pure javascript method. For professional or enterprise grade apps we recommend using npm and TypeScript which provides a far superior development experience.
A Note on Licensing SciChart.
The SciChart.js control comes with a fully-functional 30-day trial. You will need to apply a trial license to the applications that you build, including the tutorial.
A license key can be applied following the instructions at www.scichart.com/licensing-scichart-js.