SciChart.js JavaScript 2D Charts API > Annotations API > BoxAnnotation
BoxAnnotation


The BoxAnnotation type draws a rectangle at x1,y1,x2,y2 where coordinates are data-values. The BoxAnnotation supports strokeThickness, stroke and fill properties.

Coordinates may be relative or absolute according to xCoordinateModeyCoordinateMode.

Declaring a BoxAnnotation in code

The following code will declare a number of BoxAnnotations and add them to the chart.

const {
  BoxAnnotation,
  CustomAnnotation,
  LineAnnotation,
  TextAnnotation,
  NumericAxis,
  SciChartSurface,
  NumberRange,
  EHorizontalAnchorPoint,
  EVerticalAnchorPoint,
  ECoordinateMode,
  SciChartJsNavyTheme,
} = SciChart;

// or for npm import { SciChartSurface, ... } from "scichart"

async function addAnnotationToChart(divElementId) {
  const { wasmContext, sciChartSurface } = await SciChartSurface.create(
    divElementId,
    {
      theme: new SciChartJsNavyTheme(),
    }
  );
  sciChartSurface.xAxes.add(
    new NumericAxis(wasmContext, { visibleRange: new NumberRange(2, 8) })
  );
  sciChartSurface.yAxes.add(
    new NumericAxis(wasmContext, { visibleRange: new NumberRange(2, 8) })
  );

  // Add a selection of annotations to the chart
  sciChartSurface.annotations.add(
    new TextAnnotation({ fontSize: 12, text: "Draw Boxes", x1: 3.3, y1: 6.3 }),

    new BoxAnnotation({
      fill: "#279B2755",
      stroke: "#279B27",
      strokeThickness: 1,
      x1: 3.5,
      x2: 5,
      y1: 4,
      y2: 5,
    }),
    new BoxAnnotation({
      fill: "#FF191955",
      stroke: "#FF1919",
      strokeThickness: 1,
      x1: 4,
      x2: 5.5,
      y1: 4.5,
      y2: 5.5,
    }),
    new BoxAnnotation({
      fill: "#1964FF55",
      stroke: "#1964FF",
      strokeThickness: 1,
      x1: 4.5,
      x2: 6,
      y1: 5,
      y2: 6,
    })
  );
}

addAnnotationToChart("scichart-root");
const { chartBuilder, EAnnotationType } = SciChart;

// or for npm import { SciChartSurface, ... } from "scichart"

const { wasmContext, sciChartSurface } = await chartBuilder.build2DChart(
  divElementId,
  {
    annotations: [
      {
        type: EAnnotationType.SVGTextAnnotation,
        options: {
          fontSize: 12,
          text: "Draw Boxes",
          x1: 3.3,
          y1: 6.3,
        },
      },
      {
        type: EAnnotationType.RenderContextBoxAnnotation,
        options: {
          fill: "#279B2755",
          stroke: "#279B27",
          strokeThickness: 1,
          x1: 3.5,
          x2: 5,
          y1: 4,
          y2: 5,
        },
      },
      {
        type: EAnnotationType.RenderContextBoxAnnotation,
        options: {
          fill: "#FF191955",
          stroke: "#FF1919",
          strokeThickness: 1,
          x1: 4,
          x2: 5.5,
          y1: 4.5,
          y2: 5.5,
        },
      },
      {
        type: EAnnotationType.RenderContextBoxAnnotation,
        options: {
          fill: "#1964FF55",
          stroke: "#1964FF",
          strokeThickness: 1,
          x1: 4.5,
          x2: 6,
          y1: 5,
          y2: 6,
        },
      },
    ],
  }
);

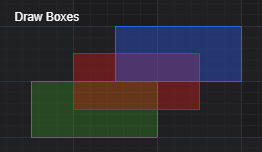
 This results in the following output:

<div id="scichart-root"></div>

  
body {
  margin: 0;
}
#scichart-root {
  width: 100%;
  height: 100vh;
}

  
// #region ExampleA
const {
  BoxAnnotation,
  CustomAnnotation,
  LineAnnotation,
  TextAnnotation,
  NumericAxis,
  SciChartSurface,
  NumberRange,
  EHorizontalAnchorPoint,
  EVerticalAnchorPoint,
  ECoordinateMode,
  SciChartJsNavyTheme,
} = SciChart;

// or for npm import { SciChartSurface, ... } from "scichart"

async function addAnnotationToChart(divElementId) {
  const { wasmContext, sciChartSurface } = await SciChartSurface.create(
    divElementId,
    {
      theme: new SciChartJsNavyTheme(),
    }
  );
  sciChartSurface.xAxes.add(
    new NumericAxis(wasmContext, { visibleRange: new NumberRange(2, 8) })
  );
  sciChartSurface.yAxes.add(
    new NumericAxis(wasmContext, { visibleRange: new NumberRange(2, 8) })
  );

  // Add a selection of annotations to the chart
  sciChartSurface.annotations.add(
    new TextAnnotation({ fontSize: 12, text: "Draw Boxes", x1: 3.3, y1: 6.3 }),

    new BoxAnnotation({
      fill: "#279B2755",
      stroke: "#279B27",
      strokeThickness: 1,
      x1: 3.5,
      x2: 5,
      y1: 4,
      y2: 5,
    }),
    new BoxAnnotation({
      fill: "#FF191955",
      stroke: "#FF1919",
      strokeThickness: 1,
      x1: 4,
      x2: 5.5,
      y1: 4.5,
      y2: 5.5,
    }),
    new BoxAnnotation({
      fill: "#1964FF55",
      stroke: "#1964FF",
      strokeThickness: 1,
      x1: 4.5,
      x2: 6,
      y1: 5,
      y2: 6,
    })
  );
}

addAnnotationToChart("scichart-root");
// #endregion

async function builderExample(divElementId) {
  // #region ExampleB
  const { chartBuilder, EAnnotationType } = SciChart;

  // or for npm import { SciChartSurface, ... } from "scichart"

  const { wasmContext, sciChartSurface } = await chartBuilder.build2DChart(
    divElementId,
    {
      annotations: [
        {
          type: EAnnotationType.SVGTextAnnotation,
          options: {
            fontSize: 12,
            text: "Draw Boxes",
            x1: 3.3,
            y1: 6.3,
          },
        },
        {
          type: EAnnotationType.RenderContextBoxAnnotation,
          options: {
            fill: "#279B2755",
            stroke: "#279B27",
            strokeThickness: 1,
            x1: 3.5,
            x2: 5,
            y1: 4,
            y2: 5,
          },
        },
        {
          type: EAnnotationType.RenderContextBoxAnnotation,
          options: {
            fill: "#FF191955",
            stroke: "#FF1919",
            strokeThickness: 1,
            x1: 4,
            x2: 5.5,
            y1: 4.5,
            y2: 5.5,
          },
        },
        {
          type: EAnnotationType.RenderContextBoxAnnotation,
          options: {
            fill: "#1964FF55",
            stroke: "#1964FF",
            strokeThickness: 1,
            x1: 4.5,
            x2: 6,
            y1: 5,
            y2: 6,
          },
        },
      ],
    }
  );
  // #endregion
}

// Uncomment this to use the builder example //builderExample("scichart-root");


Aligning a BoxAnnotation with x/yCoordinateModes

To position a BoxAnnotation so that it stretches horizontally or vertically across the viewport, use x/yCoordinateMode. e.g. the following code:

// Add BoxAnnotations with Horizontal and Vertical Stretching
sciChartSurface.annotations.add(
  new TextAnnotation({
    text: "Horizontally Stretched Box uses xCoordinateMode.Relative",
    x1: 0.1,
    y1: 2.5,
  }),

  new BoxAnnotation({
    fill: "#279B2755",
    strokeThickness: 0,
    xCoordinateMode: ECoordinateMode.Relative,
    x1: 0,
    x2: 1,
    yCoordinateMode: ECoordinateMode.DataValue,
    y1: 2,
    y2: 3,
  }),

  new TextAnnotation({
    text: "Vertcally Stretched Box uses yCoordinateMode.Relative",
    x1: 2.1,
    y1: 9.2,
  }),

  new BoxAnnotation({
    fill: "#FF191955",
    strokeThickness: 0,
    xCoordinateMode: ECoordinateMode.DataValue,
    x1: 2,
    x2: 3,
    yCoordinateMode: ECoordinateMode.Relative,
    y1: 0.0,
    y2: 1.0,
  })
);
const { wasmContext, sciChartSurface } = await chartBuilder.build2DChart(
  divElementId,
  {
    annotations: [
      {
        type: EAnnotationType.SVGTextAnnotation,
        options: {
          text: "Horizontally Stretched Box uses xCoordinateMode.Relative",
          x1: 0.1,
          y1: 2.5,
        },
      },
      {
        type: EAnnotationType.RenderContextBoxAnnotation,
        options: {
          fill: "#279B2755",
          strokeThickness: 0,
          xCoordinateMode: ECoordinateMode.Relative,
          x1: 0,
          x2: 1,
          yCoordinateMode: ECoordinateMode.DataValue,
          y1: 2,
          y2: 3,
        },
      },
      {
        type: EAnnotationType.RenderContextBoxAnnotation,
        options: {
          fill: "#FF191955",
          strokeThickness: 0,
          xCoordinateMode: ECoordinateMode.DataValue,
          x1: 2,
          x2: 3,
          yCoordinateMode: ECoordinateMode.Relative,
          y1: 0.0,
          y2: 1.0,
        },
      },
    ],
  }
);

results in the following output:

<div id="scichart-root"></div>

  
body {
  margin: 0;
}
#scichart-root {
  width: 100%;
  height: 100vh;
}

  
const {
  BoxAnnotation,
  CustomAnnotation,
  LineAnnotation,
  TextAnnotation,
  NumericAxis,
  SciChartSurface,
  NumberRange,
  EHorizontalAnchorPoint,
  EVerticalAnchorPoint,
  ECoordinateMode,
  SciChartJsNavyTheme,
} = SciChart;

// or for npm import { SciChartSurface, ... } from "scichart"

async function addAnnotationToChart(divElementId) {
  const { wasmContext, sciChartSurface } = await SciChartSurface.create(
    divElementId,
    {
      theme: new SciChartJsNavyTheme(),
    }
  );
  sciChartSurface.xAxes.add(new NumericAxis(wasmContext));
  sciChartSurface.yAxes.add(new NumericAxis(wasmContext));

  // #region ExampleA
  // Add BoxAnnotations with Horizontal and Vertical Stretching
  sciChartSurface.annotations.add(
    new TextAnnotation({
      text: "Horizontally Stretched Box uses xCoordinateMode.Relative",
      x1: 0.1,
      y1: 2.5,
    }),

    new BoxAnnotation({
      fill: "#279B2755",
      strokeThickness: 0,
      xCoordinateMode: ECoordinateMode.Relative,
      x1: 0,
      x2: 1,
      yCoordinateMode: ECoordinateMode.DataValue,
      y1: 2,
      y2: 3,
    }),

    new TextAnnotation({
      text: "Vertcally Stretched Box uses yCoordinateMode.Relative",
      x1: 2.1,
      y1: 9.2,
    }),

    new BoxAnnotation({
      fill: "#FF191955",
      strokeThickness: 0,
      xCoordinateMode: ECoordinateMode.DataValue,
      x1: 2,
      x2: 3,
      yCoordinateMode: ECoordinateMode.Relative,
      y1: 0.0,
      y2: 1.0,
    })
  );
  // #endregion
}

addAnnotationToChart("scichart-root");

async function builderExample(divElementId) {
  const { chartBuilder, EAnnotationType } = SciChart;

  // or for npm import { SciChartSurface, ... } from "scichart"

  // #region ExampleB
  const { wasmContext, sciChartSurface } = await chartBuilder.build2DChart(
    divElementId,
    {
      annotations: [
        {
          type: EAnnotationType.SVGTextAnnotation,
          options: {
            text: "Horizontally Stretched Box uses xCoordinateMode.Relative",
            x1: 0.1,
            y1: 2.5,
          },
        },
        {
          type: EAnnotationType.RenderContextBoxAnnotation,
          options: {
            fill: "#279B2755",
            strokeThickness: 0,
            xCoordinateMode: ECoordinateMode.Relative,
            x1: 0,
            x2: 1,
            yCoordinateMode: ECoordinateMode.DataValue,
            y1: 2,
            y2: 3,
          },
        },
        {
          type: EAnnotationType.RenderContextBoxAnnotation,
          options: {
            fill: "#FF191955",
            strokeThickness: 0,
            xCoordinateMode: ECoordinateMode.DataValue,
            x1: 2,
            x2: 3,
            yCoordinateMode: ECoordinateMode.Relative,
            y1: 0.0,
            y2: 1.0,
          },
        },
      ],
    }
  );
  // #endregion
}

// Uncomment this to use the builder example //builderExample("scichart-root");


See Also