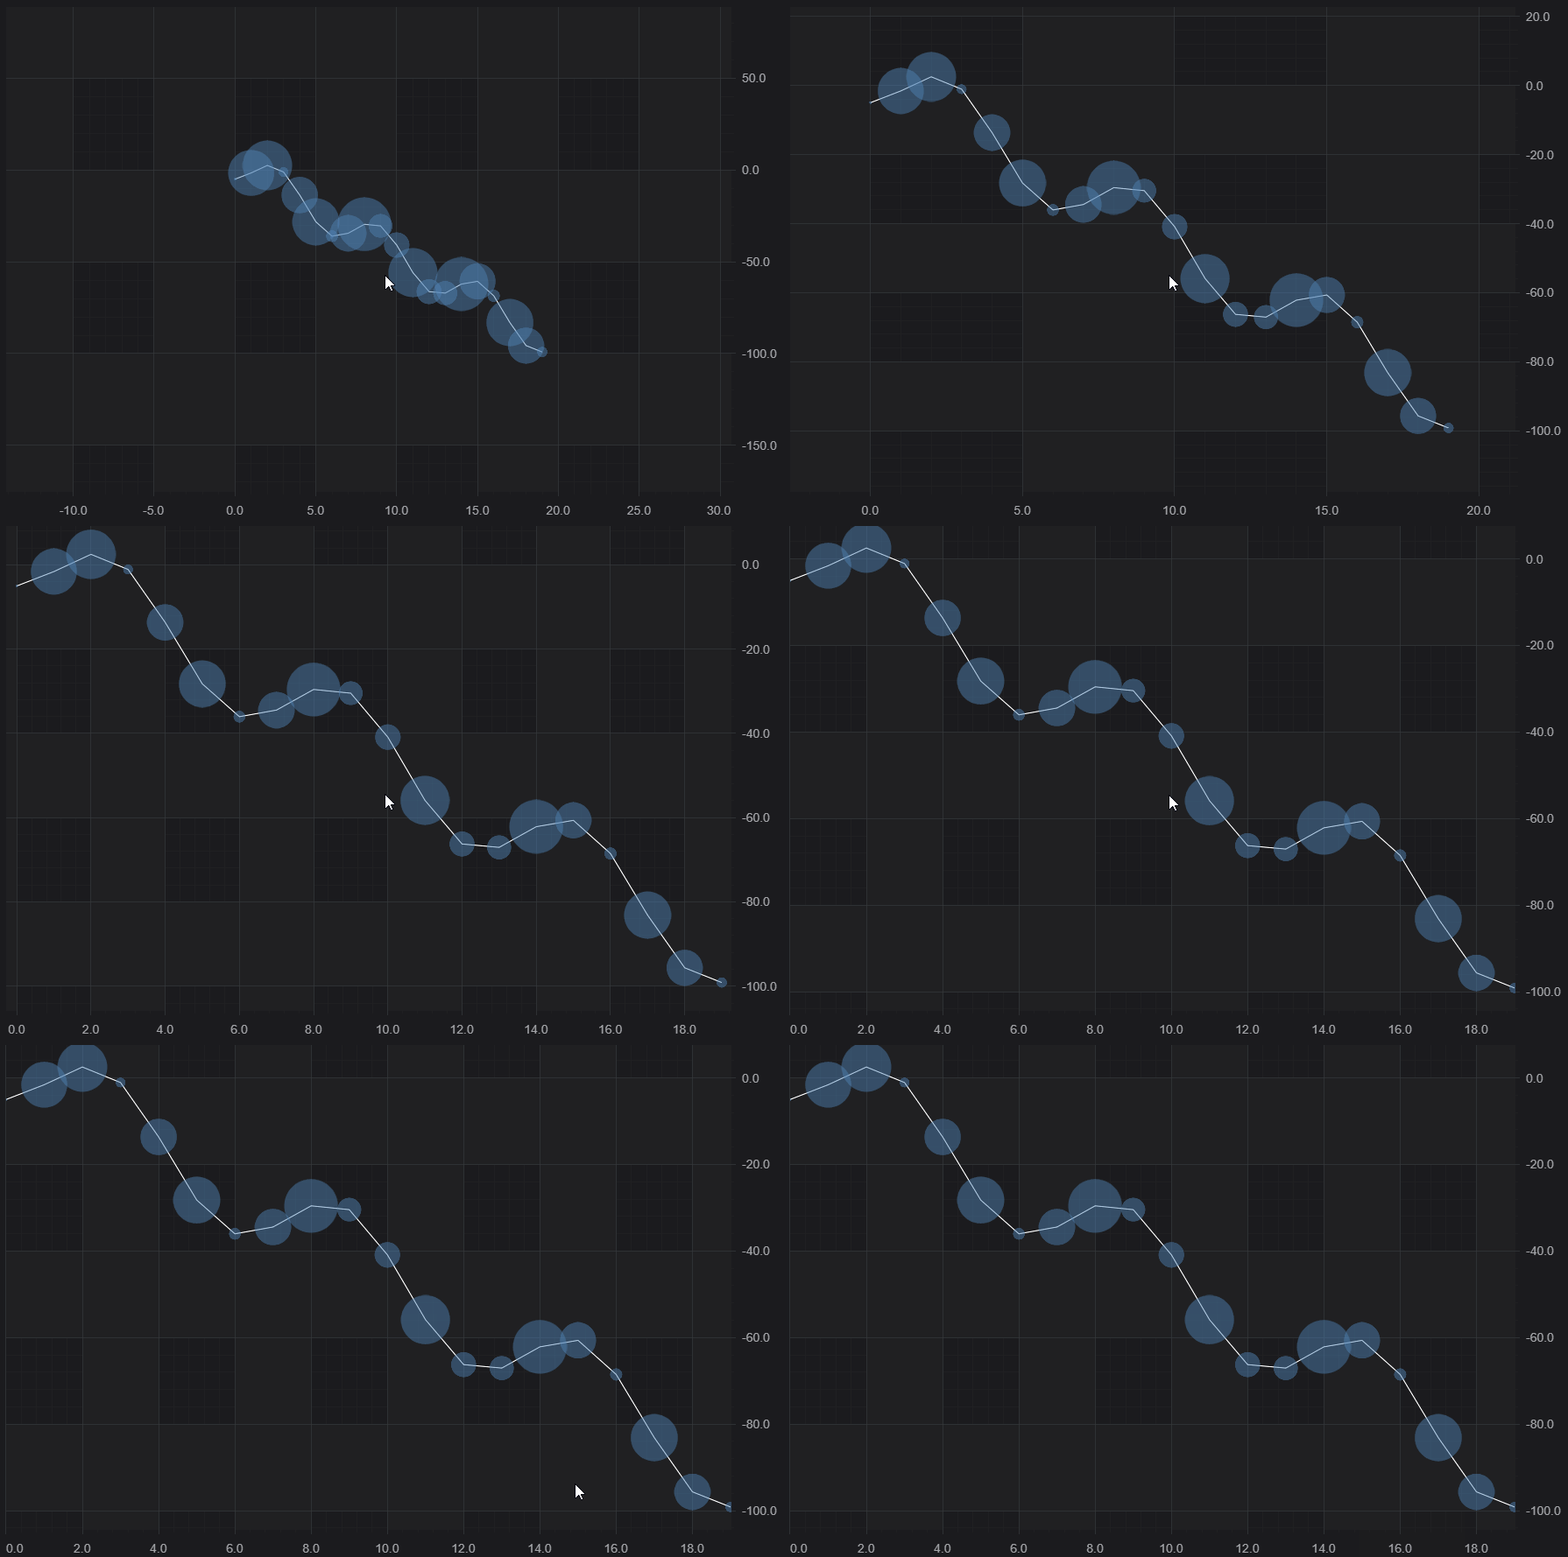
SciChart.js provides the ability to Zoom Extents the entire chart (zoom to fit data) by double-clicking the chart area with the ZoomExtentsModifier, available out of the box.
Besides common features which are inherited from the ChartModifierBase class, the ZoomExtentsModifier allows animated zooming via the isAnimated, animationDuration and easingFunction properties.
Adding a ZoomExtentsModifier to a Chart
A ZoomExtentsModifier can be added to the sciChartSurface.chartModifiers collection to enable zoom to fit behavior. For example:
|
Copy Code
|
|
|---|---|
// Create a SciChartSurface const { sciChartSurface, wasmContext } = await SciChartSurface.create(divElementId); // Add Zoom Extents behavior const zoomExtentsModifier = new ZoomExtentsModifier({ isAnimated: true, animationDuration: 400, easingFunction: easing.outExpo }); sciChartSurface.chartModifiers.add(zoomExtentsModifier ); |
|
This results in the following behavior when double-clicking the chart:

Zoom to a Preset Range
If you would like the double-click to zoom to some preset range, rather than the data range, you can set zoomExtentsRange on the axes. In addition, if you are setting an initial visibleRange on an axis and would like zoomExtents to return to this range, you can just set zoomExtentsToInitialRange true, which will set zoomExtentsRange to the visibleRange passed in.
If you just want to have some space around your data, set growBy instead.
