Easy Overview charts with SciChartOverview
The SciChartOverview Control is a component which can be used for navigating a 2D chart. It behaves like a minimap of the chart. The SciChartOverview is a separate chart which uses the original chart for configuration and displays the full range of it's data.
Benefits of the SciChartOverview:
- Displays an overview of the whole chart
- Allows you to select the visible range that should be displayed by dragging & resizing an element on the overview control
- Allows instantly scrolling to a specified range by clicking on the overview
- Has an ability to transform renderable series copied from the original chart before displaying
Using the SciChartOverview Control
The SciChartOverview uses a separate html element for displaying and behaves like a usual chart. So to create an instance of the SciChartOverview we need to pass a reference to the main surface and an id of the container element to the SciChartOverview.create() method:
import { SciChartOverview } from "scichart/Charting/Visuals/SciChartOverview";

SciChartOverview.create(sciChartSurface, overviewDivElementId)
In the following sections we will show how to add a basic SciChartOverview control and how to customize it.
Basic Setup
Lets define 2 chart containers on the HTML page. Make sure to specify their ids.
<!-- the Div where the SciChartSurface will reside -->
<div id="scichart-div-1" style="width: 800px; height: 600px;"></div>
<!-- the Div where the SciChartOverview will reside -->
<div id="scichart-div-2" style="width: 800px; height: 100px;"></div>
Next, let's instantiate a basic chart and add some dataseries:
Now that we have an empty chart with axis and data, let's bind a SciChartOverview to it:
import { SciChartOverview } from "scichart/Charting/Visuals/SciChartOverview";

SciChartOverview.create(sciChartSurface, overviewDivElementId)
At this point we should get a working example of the Overview control.
By default the overview will clone the original renderable series on the associated chart to the overview, but both series share the same dataSeries, so data updates will apply to both charts. Check
Optional Parameters for creating SciChartOverview section for info on how to override this behavior.
Adding Zoom / Pan Modifiers to demonstrate the overview
Dragging or resizing the selection area on the overview will automatically update the visible range of the main chart, and zooming/panning the main chart will update the selection on the overview.
To demonstrate this, let's add some zoom / pan modifiers to the chart. Modify your code to add the following interactivity modifiers:
import { ZoomPanModifier } from "scichart/Charting/ChartModifiers/ZoomPanModifier";
import { MouseWheelZoomModifier } from 'scichart/Charting/ChartModifiers/MouseWheelZoomModifier';
import { ZoomExtentsModifier } from 'scichart/Charting/ChartModifiers/ZoomExtentsModifier';
//...
sciChartSurface.chartModifiers.add(new ZoomPanModifier(), new ZoomExtentsModifier(), new MouseWheelZoomModifier());
Notice how the selected area rectangle on the Overview Control updates when you zoom or scroll the main chart horizontally:
Customizing the Overview Control
Positioning
Since the control is using a separate element for displaying, you can place and style this container element as you would normally do with HTML elements.
Modifying the Overview Chart
The SciChartOverview.create() method returns an instance of SciChartOverview, which exposes properties for accessing and customizing the underlying chart. The most important is overviewSciChartSurface which is the actual SciChartSurface used by the overview.
import { SciChartJSLightTheme } from 'scichart/Charting/Themes/SciChartJSLightTheme';
import { Thickness } from 'scichart/Core/Thickness';
// ...
// add styling to the overview component
overview.applyTheme(new SciChartJSLightTheme());
// Default padding is 10
overview.overviewSciChartSurface.padding = Thickness.fromNumber(0);
// overviewXAxis provides a shortcut to overviewSciChartSurface.xAxes.get(0)
overview.overviewXAxis.isVisible = true;
overview.overviewXAxis.isInnerAxis = true;
overview.overviewXAxis.drawMinorGridLines = false;
overview.overviewXAxis.labelProvider.precision = 0;
// Setting an id on the series makes it easier to get and customise it on the overview
overview.overviewSciChartSurface.renderableSeries.getById("MainSeries").stroke = "#0a6fc2";
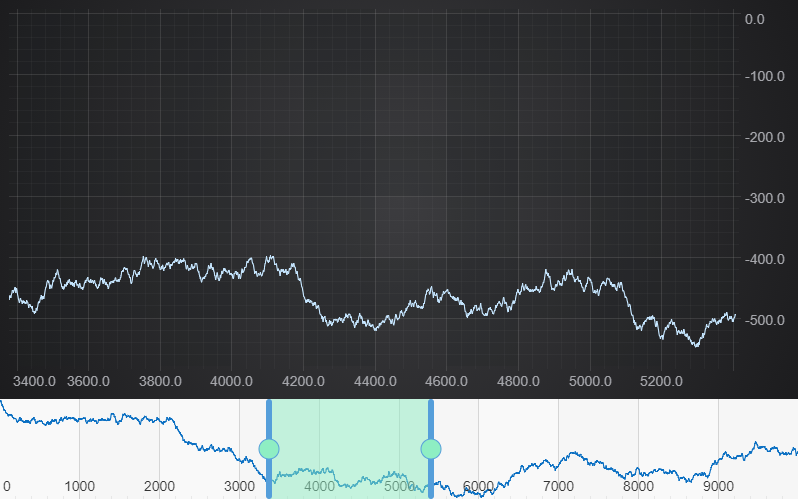
Customizing the Selection and Range Annotations
SciChart Overview also allows to specify custom SVGs for the selection control using properties of the OverviewRangeSelectionModifier, which can be accessed via the SciChartOverview.rangeSelectionModifier property:
// Customize the selected area
overview.rangeSelectionModifier.rangeSelectionAnnotation.svgString =
    `<svg width="50" height="50" preserveAspectRatio="none" xmlns="http://www.w3.org/2000/svg">
    <rect width="100%" height="100%" style="fill: rgb(142, 238, 195)">
    </rect>
    </svg>`;
// Customize the unselected area
overview.rangeSelectionModifier.unselectedsvgString =
    `<svg width="50" height="50" preserveAspectRatio="none" xmlns="http://www.w3.org/2000/svg">
    <rect width="100%" height="100%" style="fill:transparent">
    </rect>
    </svg>`
// Custom SVG template function for grab handles of the selection control
overview.rangeSelectionModifier.rangeSelectionAnnotation.adornerSvgStringTemplate =
    (x1: number, y1: number, x2: number, y2: number) => {
        const delta = 3;
        const ADORNER_GRIP_RADIUS = 10;
        return `<svg xmlns="http://www.w3.org/2000/svg">
        <line x1="${x2}" y1="${y1 + delta}" x2="${x2}" y2="${y2 - delta}" stroke="rgb(85, 158, 218)" stroke-width="6" stroke-linecap="round" />
        <line x1="${x1}" y1="${y1 + delta}" x2="${x1}" y2="${y2 - delta}" stroke="rgb(85, 158, 218)" stroke-width="6" stroke-linecap="round" />
        <circle cx="${x1}" cy="${y1 / 2 + y2 / 2}" r="${ADORNER_GRIP_RADIUS}" fill="rgb(142, 238, 195)" stroke="rgb(85, 158, 218)"/>
        <circle cx="${x2}" cy="${y1 / 2 + y2 / 2}" r="${ADORNER_GRIP_RADIUS}" fill="rgb(142, 238, 195)" stroke="rgb(85, 158, 218)"/>
        </svg>`;
    };
This results in the following output:
Optional Parameters for creating SciChartOverview
SciChartOverview.create() accepts optional params object described in IOverviewOptions. These params allow to specify axis ids which should be used for binding AxisBase2D.visibleRange updates to the overview control via IOverviewOptions.mainAxisId and IOverviewOptions.secondaryAxisId.
Note: specifying the IOverviewOptions.mainAxisId and IOverviewOptions.secondaryAxisId is required when you are using custom axis ids (as in case when you have multiple X or Y axes).
You should only specify X axis as IOverviewOptions.mainAxisId and Y axis as IOverviewOptions.secondaryAxisId.
Another important parameter is IOverviewOptions.transformRenderableSeries, which is used to set a transform function for projecting the renderable series from the main chart to the overview control.
If you want to use SciChartOverview for scrolling a vertical axis check out the Overview for Vertical Chart section below.
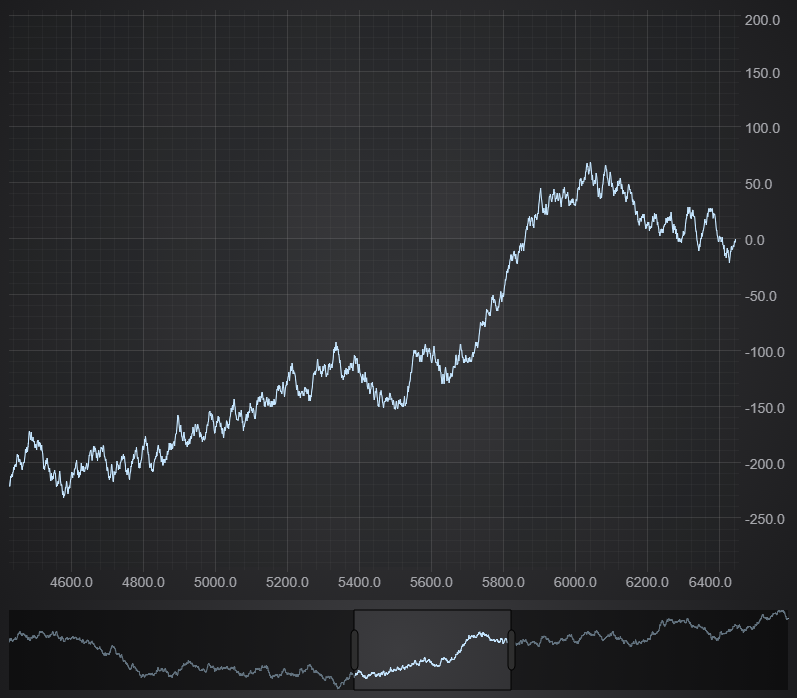
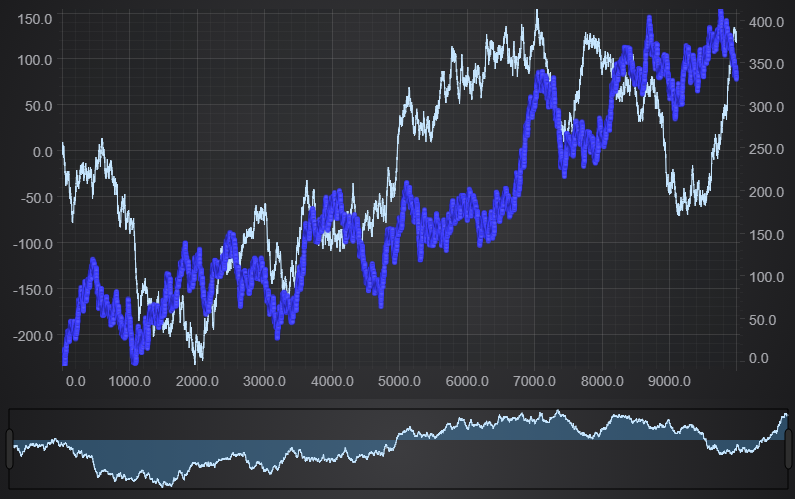
Worked Example: Using Optional Parameters with the SciChartOverview
Here we will demonstrate an example of using optional params mentioned above.
import { XyScatterRenderableSeries } from 'scichart/Charting/Visuals/RenderableSeries/XyScatterRenderableSeries';
import { EllipsePointMarker } from 'scichart/Charting/Visuals/PointMarkers/EllipsePointMarker';
import { EAxisAlignment } from 'scichart/types/AxisAlignment';
import { SciChartOverview } from "scichart/Charting/Visuals/SciChartOverview";
// ...
const { wasmContext, sciChartSurface } = await SciChartSurface.create(divElementId);
const xAxis = new NumericAxis(wasmContext, { id: "xAxis" });
const yAxis = new NumericAxis(wasmContext, { id: "yAxis", axisAlignment: EAxisAlignment.Left });
const yAxis2 = new NumericAxis(wasmContext, { id: "yAxis2", axisAlignment: EAxisAlignment.Right });
sciChartSurface.xAxes.add(xAxis);
sciChartSurface.yAxes.add(yAxis, yAxis2);
const dataSeries = new XyDataSeries(wasmContext);
generateDataSeries(dataSeries);
const rendSeries = new FastLineRenderableSeries(wasmContext, { dataSeries });
const dataSeries2 = new XyDataSeries(wasmContext);
generateDataSeries(dataSeries2);
const rendSeries2 = new XyScatterRenderableSeries(wasmContext, {
    dataSeries: dataSeries2,
    pointMarker: new EllipsePointMarker(wasmContext)
});
// Set the axis ids for the series
rendSeries.xAxisId = xAxis.id;
rendSeries.yAxisId = yAxis.id;
rendSeries2.xAxisId = xAxis.id;
rendSeries2.yAxisId = yAxis2.id;
sciChartSurface.renderableSeries.add(rendSeries, rendSeries2);
// A function to filter and convert renderable series for the overview
const customTransformFunction = (renderableSeries: IRenderableSeries) => {
    // return undefined to skip series not on the main axes
    if (renderableSeries.xAxisId !== xAxis.id || renderableSeries.yAxisId !== yAxis.id) {
        return undefined;
    }
    // Convert to a different Renderable Series type
    return new FastMountainRenderableSeries(wasmContext, {
        dataSeries: renderableSeries.dataSeries
    });
};
// Create a SciChartOverview with custom axis Ids and transform
const overview = await SciChartOverview.create(sciChartSurface, overviewDivElementId, {
    mainAxisId: xAxis.id,
    secondaryAxisId: yAxis.id,
    transformRenderableSeries: customTransformFunction,
});
This produces the following:
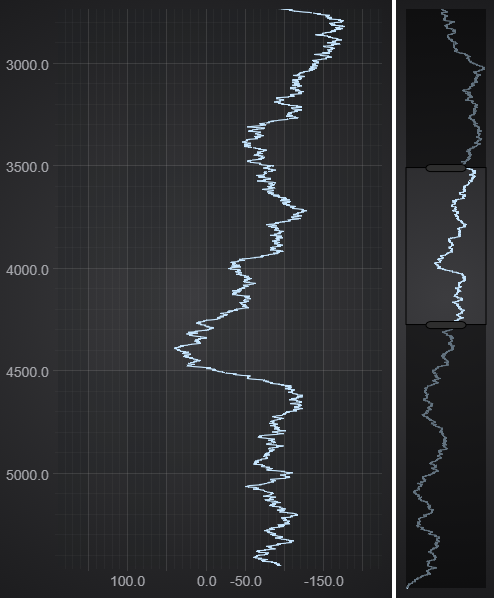
Using the SciChartOverview in a Vertical Chart
The SciChartOverview supports Vertical Chart automatically. So to get a working example of the overview for Vertical Chart we can simply update the code from the Basic Setup section above by changing the axes definitions as following:
import { EAxisAlignment } from 'scichart/types/AxisAlignment';
// ...
const xAxis = new NumericAxis(wasmContext, { axisAlignment: EAxisAlignment.Left });
const yAxis = new NumericAxis(wasmContext, { axisAlignment: EAxisAlignment.Bottom });
This will make the chart vertical and as a result the overview will now be resizable and movable in vertical direction. Also you may have to position the container HTML element according to your needs.