
 |
The TextAnnotation type draws a text label at the x1,y1 location where coordinates are data-values. The TextAnnotation supports text, fontSize, fontWeight, fontFamily and textColor properties. Coordinates may be relative or absolute according to xCoordinateMode, yCoordinateMode. |
Declaring a TextAnnotation in code
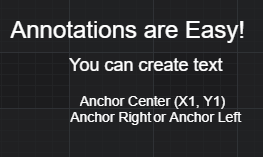
The following code will declare a number of TextAnnotations and add them to the chart.
This results in the following output:
<div id="scichart-root"></div>
body {
margin: 0;
}
#scichart-root {
width: 100%;
height: 100vh;
}
// #region ExampleA
const {
  BoxAnnotation,
  CustomAnnotation,
  LineAnnotation,
  TextAnnotation,
  NumericAxis,
  SciChartSurface,
  NumberRange,
  EHorizontalAnchorPoint,
  EVerticalAnchorPoint,
  ECoordinateMode,
  SciChartJsNavyTheme,
} = SciChart;

// or for npm import { SciChartSurface, ... } from "scichart"

async function addAnnotationToChart(divElementId) {
  const { wasmContext, sciChartSurface } = await SciChartSurface.create(
    divElementId,
    {
      theme: new SciChartJsNavyTheme(),
    }
  );
  sciChartSurface.xAxes.add(new NumericAxis(wasmContext));
  sciChartSurface.yAxes.add(new NumericAxis(wasmContext));

  // Add a selection of annotations to the chart
  sciChartSurface.annotations.add(
    // Add TextAnnotations in the top left of the chart
    new TextAnnotation({
      text: "Annotations are Easy!",
      fontSize: 24,
      x1: 0.3,
      y1: 9.7,
    }),
    new TextAnnotation({
      text: "You can create text",
      fontSize: 18,
      x1: 1,
      y1: 9,
    }),

    // Add TextAnnotations with anchor points
    new TextAnnotation({
      text: "Anchor Center (X1, Y1)",
      horizontalAnchorPoint: EHorizontalAnchorPoint.Center,
      verticalAnchorPoint: EVerticalAnchorPoint.Bottom,
      x1: 2,
      y1: 8,
    }),
    new TextAnnotation({
      text: "Anchor Right",
      horizontalAnchorPoint: EHorizontalAnchorPoint.Right,
      verticalAnchorPoint: EVerticalAnchorPoint.Top,
      x1: 2,
      y1: 8,
    }),
    new TextAnnotation({
      text: "or Anchor Left",
      horizontalAnchorPoint: EHorizontalAnchorPoint.Left,
      verticalAnchorPoint: EVerticalAnchorPoint.Top,
      x1: 2,
      y1: 8,
    })
  );
}

addAnnotationToChart("scichart-root");
// #endregion
async function builderExample(divElementId) {
// #region ExampleB
const { chartBuilder, EAnnotationType } = SciChart;

// or for npm import { SciChartSurface, ... } from "scichart"

const { wasmContext, sciChartSurface } = await chartBuilder.build2DChart(
  divElementId,
  {
    annotations: [
      {
        type: EAnnotationType.SVGTextAnnotation,
        options: {
          text: "Annotations are Easy!",
          fontSize: 24,
          x1: 0.3,
          y1: 9.7,
        },
      },
      {
        type: EAnnotationType.SVGTextAnnotation,
        options: {
          text: "You can create text",
          fontSize: 18,
          x1: 1,
          y1: 9,
        },
      },
      {
        type: EAnnotationType.SVGTextAnnotation,
        options: {
          text: "Anchor Center (X1, Y1)",
          horizontalAnchorPoint: EHorizontalAnchorPoint.Center,
          verticalAnchorPoint: EVerticalAnchorPoint.Bottom,
          x1: 2,
          y1: 8,
        },
      },
      {
        type: EAnnotationType.SVGTextAnnotation,
        options: {
          text: "Anchor Right",
          horizontalAnchorPoint: EHorizontalAnchorPoint.Right,
          verticalAnchorPoint: EVerticalAnchorPoint.Top,
          x1: 2,
          y1: 8,
        },
      },
      {
        type: EAnnotationType.SVGTextAnnotation,
        options: {
          text: "or Anchor Left",
          horizontalAnchorPoint: EHorizontalAnchorPoint.Left,
          verticalAnchorPoint: EVerticalAnchorPoint.Top,
          x1: 2,
          y1: 8,
        },
      },
    ],
  }
);
// #endregion
}
// Uncomment this to use the builder example //builderExample("scichart-root");
Positioning a TextAnnotation with horizontal/vertical Anchor Points
A TextAnnotation only requires coordinates x1,y1 to be set. The alignment of the text around this coordinate is controlled by the horizontalAnchorPoint, verticalAnchorPoint properties.
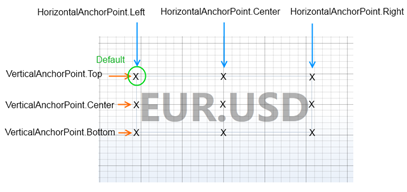
Above: Set the horizontalAnchorPoint, and verticalAnchorPoint property to determine which anchor point (horizontal: left, center, right or vertical: top, center, bottom) the x1,y2 coordinate is bound to.
Aligning a LineAnnotation with x/yCoordinateModes
Like other annotation types, the TextAnnotation can be positioned relatively or absolute using xCoordinateMode, yCoordinateMode property.
For example. To create a watermark in the centre of the chart, use this code:
This results in the following output:
<div id="scichart-root"></div>
body {
  margin: 0;
}
#scichart-root {
  width: 100%;
  height: 100vh;
}
const {
BoxAnnotation,
CustomAnnotation,
LineAnnotation,
TextAnnotation,
NumericAxis,
SciChartSurface,
NumberRange,
EHorizontalAnchorPoint,
EVerticalAnchorPoint,
ECoordinateMode,
SciChartJsNavyTheme,
EAnnotationLayer,
} = SciChart;
// or for npm import { SciChartSurface, ... } from "scichart"
async function addAnnotationToChart(divElementId) {
const { wasmContext, sciChartSurface } = await SciChartSurface.create(
divElementId,
{
theme: new SciChartJsNavyTheme(),
}
);
sciChartSurface.xAxes.add(new NumericAxis(wasmContext));
sciChartSurface.yAxes.add(new NumericAxis(wasmContext));
// #region ExampleA
// Add a TextAnnotation using CoordinateMode Relative and Horizontal/Vertical Anchor Point
// to create a watermark in a fixed position in the middle of the chart
sciChartSurface.annotations.add(
  // Watermark with CoordinateMode Relative
  new TextAnnotation({
    text: "Create a Watermark",
    horizontalAnchorPoint: EHorizontalAnchorPoint.Center,
    verticalAnchorPoint: EVerticalAnchorPoint.Center,
    x1: 0.5,
    y1: 0.5,
    fontSize: 56,
    fontWeight: "Bold",
    textColor: "#FFFFFF22",
    xCoordinateMode: ECoordinateMode.Relative,
    yCoordinateMode: ECoordinateMode.Relative,
    annotationLayer: EAnnotationLayer.BelowChart,
  })
);
// #endregion
}
addAnnotationToChart("scichart-root");
async function builderExample(divElementId) {
const { chartBuilder, EAnnotationType } = SciChart;
// or for npm import { SciChartSurface, ... } from "scichart"
// #region ExampleB
const { wasmContext, sciChartSurface } = await chartBuilder.build2DChart(
  divElementId,
  {
    annotations: [
      {
        type: EAnnotationType.SVGTextAnnotation,
        options: {
          text: "Create a Watermark",
          horizontalAnchorPoint: EHorizontalAnchorPoint.Center,
          verticalAnchorPoint: EVerticalAnchorPoint.Center,
          x1: 0.5,
          y1: 0.5,
          fontSize: 56,
          fontWeight: "Bold",
          textColor: "#FFFFFF22",
          xCoordinateMode: ECoordinateMode.Relative,
          yCoordinateMode: ECoordinateMode.Relative,
          annotationLayer: EAnnotationLayer.BelowChart,
        },
      },
    ],
  }
);
// #endregion
}
// Uncomment this to use the builder example //builderExample("scichart-root");