
If you want to have absolute control over the gridlines, labels and minor gridline spacing in SciChart.js, you can use the TickProvider API.
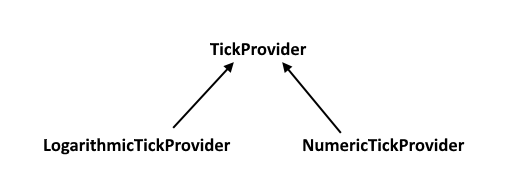
Every axis implementation has an axisCore.tickProvider property. This accepts a class which inherits TickProvider. Several classes are built-in such as NumericTickProvider and LogarithmicTickProvider which SciChart uses internally.
The inheritence diagram for TickProviders in SciChart.js looks like this:
Example 1: Our NumericTickProvider
Below here how our NumericTickProvider is implemented. This code is shared for example purposes so you can see the inner workings of this class. For a worked example, scroll down.
In the code below:
- The method getMajorTicks() returns an array of values where you want to place major gridlines and labels.
- The method getMinorTicks() returns an array of values where you want to place minor gridlines.
Both arrays are in data-coordinates, not pixels. E.g. if your Chart has data between 0..10 then you want to set major gridlines at 2,4,6,8 then return [2, 4, 6, 8] as an array from getMajorTicks.
| Example Title |
Copy Code
|
|---|---|
// Definition of NumericTickProvider from the SciChart.js source code. export class NumericTickProvider extends TickProvider { private readonly minDeltaValue: number = 1e-13; private webAssemblyContext: TSciChart | TSciChart3D; constructor(webAssemblyContext: TSciChart | TSciChart3D) { super(); this.webAssemblyContext = webAssemblyContext; } /** * Gets an array of minor ticks (data-values values where SciChart will place minor gridlines). */ public getMinorTicks(minorDelta: number, majorDelta: number, visibleRange: NumberRange): number[] { const deltaRange = new NumberRange(minorDelta, majorDelta); const tickRange = visibleRange; if (!this.isParamsValid(tickRange, deltaRange)) { return []; } return this.calculateTicks(tickRange, deltaRange.min, deltaRange.max); } /** * Gets an array of major ticks (data-values values where SciChart will place labels and major gridlines). */ public getMajorTicks(minorDelta: number, majorDelta: number, visibleRange: NumberRange): number[] { const deltaRange = new NumberRange(minorDelta, majorDelta); const tickRange = visibleRange; if (!this.isParamsValid(tickRange, deltaRange)) { return []; } return this.calculateTicks(tickRange, deltaRange.max, deltaRange.max); } /** * @summary Performs sanity checks to see if parameters are valid. */ protected isParamsValid(visibleRange: NumberRange, deltaRange: NumberRange): boolean { Guard.notNull(visibleRange, "visibleRange"); Guard.notNull(deltaRange, "deltaRange"); return ( isRealNumber(visibleRange.min) && isRealNumber(visibleRange.max) && deltaRange.min > 0 && deltaRange.max > 0 ); } /** * @summary Performs the Numeric tick calculation */ protected calculateTicks(visibleRange: NumberRange, delta: number, majorDelta: number): number[] { const results: number[] = []; const min = visibleRange.min; const max = visibleRange.max; let current = min; const calcMajorTicks = delta === majorDelta; const numberUtil = this.webAssemblyContext.NumberUtil; if (!numberUtil.IsDivisibleBy(current, delta)) { current = numberUtil.RoundUp(current, delta); } const start = current; let tickCount = 0; while (current <= max) { // TRUE if major ticks are calculated && Current is divisible by MajorDelta // or if minor ticks are calculated && Current is NOT divisible by MajorDelta if (!(numberUtil.IsDivisibleBy(current, majorDelta) !== calcMajorTicks)) { results.push(current); } current = start + ++tickCount * delta; } return results; } } |
|
Example 2: Custom TickProvider
Below we've included a worked example of a custom tickprovider. This is a very simplistic implementation that returns hard-coded spacings for major & minor gridlines. However, it could be easily customised to behave dynamically based on the minorDelta, majorDelta and visibleRange passed into the getMajorTicks/getMinorTicks functions.
First, create the TickProvider class and implement getMajorTicks/getMinorTicks:
Then, apply the TickProvider to an axis like this:
This results in an uneven spacing of ticklines or gridlines in SciChart which looks like this:
<div id="scichart-root" ></div>
body { margin: 0; }
#scichart-root { width: 100%; height: 100vh; }
// #region ExampleA
const { NumericTickProvider } = SciChart;
// or, for npm, import { NumericTickProvider, ... } from "scichart"

// Custom TickProvider implementation
//
class CustomTickProvider extends NumericTickProvider {
  constructor(wasmContext) {
    super(wasmContext);
  }

  // returns an array of minor gridline positions in data space
  // Called once per draw. Can be dynamic
  getMinorTicks(minorDelta, majorDelta, visibleRange) {
    // Todo here: calculate your tick spacing based on axis minorDelta, majorDelta and visibleRange
    // Note we do not return major ticks here, so minor ticks exclude the majors
    return [
      0.2, 0.4, 0.6, 0.8, 1.2, 1.4, 1.6, 1.8, 2.2, 2.4, 2.6, 2.8, 3.0, 3.2, 3.4,
      3.6, 3.8, 4.2, 4.4, 4.6, 4.8, 5.0, 5.2, 5.4, 5.6, 5.8, 6.0, 6.2, 6.4, 6.6,
      6.8, 7.0, 7.2, 7.4, 7.6, 7.8, 8.2, 8.4, 8.6, 8.8, 9.0, 9.2, 9.4, 9.6, 9.8,
    ];
  }

  // returns an array of major gridline positions in data space
  // Called once per draw. Can be dynamic
  getMajorTicks(minorDelta, majorDelta, visibleRange) {
    // Todo here: calculate your tick spacing based on axis minorDelta, majorDelta and visibleRange
    // Note we return the major tick intervals and label intervals here
    return [0, 1, 2, 4, 8];
  }
}
// #endregion
async function tickProvider(divElementId) {
// #region ExampleB
// Demonstrates how to apply a custom tickprovider in SciChart.js
const { SciChartSurface, NumericAxis, SciChartJsNavyTheme } = SciChart;

// or, for npm, import { SciChartSurface, ... } from "scichart"

const { wasmContext, sciChartSurface } = await SciChartSurface.create(
  divElementId,
  {
    theme: new SciChartJsNavyTheme(),
  }
);

// Adjust major/minor gridline style to make it clearer for the demo
const styleOptions = {
  majorGridLineStyle: { color: "#50C7E077" },
  minorGridLineStyle: { color: "#50C7E033" },
};

// Create an XAxis on the bottom
const xAxis = new NumericAxis(wasmContext, {
  ...styleOptions,
  axisTitle: "Custom TickProvider - unequally spaced gridlines",
});

// Apply the tickProvider
xAxis.tickProvider = new CustomTickProvider(wasmContext);

// Add the xAxis to the chart
sciChartSurface.xAxes.add(xAxis);

// You can also apply a tickprovider in constructor options
sciChartSurface.yAxes.add(
  new NumericAxis(wasmContext, {
    tickProvider: new CustomTickProvider(wasmContext),
    ...styleOptions,
  })
);
// #endregion
}
tickProvider("scichart-root");
async function builderExample(divElementId) {
// Demonstrates how to apply a custom tickprovider in SciChart.js using the Builder API
const { chartBuilder, EThemeProviderType, EAxisType } = SciChart;
// or, for npm, import { chartBuilder, ... } from "scichart"
// #region ExampleC
const { wasmContext, sciChartSurface } = await chartBuilder.build2DChart(
  divElementId,
  {
    surface: { theme: { type: EThemeProviderType.Dark } },
    xAxes: {
      type: EAxisType.NumericAxis,
      options: {
        axisTitle: "Custom TickProvider - unequally spaced gridlines",
      },
    },
    yAxes: {
      type: EAxisType.NumericAxis,
      options: {
        axisTitle: "Y Axis",
      },
    },
  }
);

// Tickproviders must be applied after the fact using the Builder API
sciChartSurface.xAxes.get(0).tickProvider = new CustomTickProvider(
  wasmContext
);
// #endregion
}
// Uncomment this to use the builder example //builderExample("scichart-root");