
In SciChart.js, all positioning and layout of axis are done with Layout Strategies. A list of default built-in strategies can be found below.
| Layout Strategy | Use on | Apply to | Behaviour |
| BottomAlignedOuterAxisLayoutStrategy | X Axis | Bottom side | Default behaviour |
| BottomAlignedOuterHorizontallyStackedAxisLayoutStrategy | X Axis | Bottom side | Horizontal stacking behaviour |
| LeftAlignedOuterAxisLayoutStrategy | Y Axis | Left side | Default behaviour |
| RightAlignedOuterAxisLayoutStrategy | Y Axis | Right side | Default behaviour |
| TopAlignedOuterAxisLayoutStrategy | X Axis | Top side | Default behaviour |
| LeftAlignedOuterVerticallyStackedAxisLayoutStrategy | Y Axis | Left side | Vertical stacking behaviour |
| RightAlignedOuterVerticallyStackedAxisLayoutStrategy | Y Axis | Right side | Vertical stacking behaviour |
| TopAlignedOuterHorizontallyStackedAxisLayoutStrategy | X Axis | Top side | Horizontal stacking behaviour |
By applying these strategies to the SciChartSurface you can achieve various layouts, such as Central Axis Layout or Vertically Stacked Axis Layout.
However, you can also create your own layout managers for custom or complex axis layouts.
Here's a worked example:
Example: Custom Stacked and Normal Axis Layout
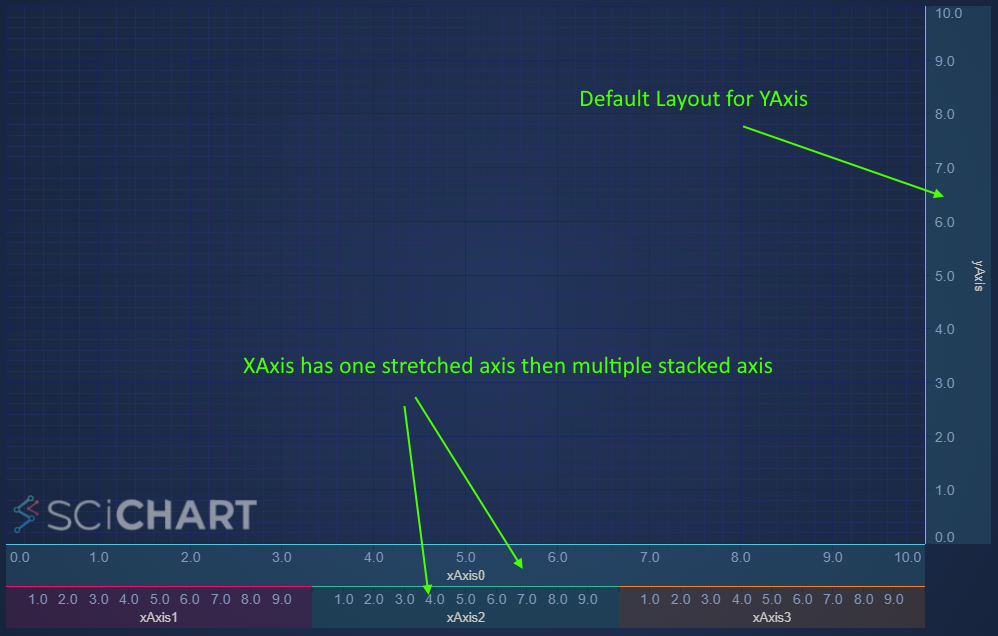
A user on the SciChart Forums asked us how to combine Horizontally Stacked Axis behaviour with default behaviour, to achieve a layout like this:
This is possible by creating a custom layout strategy.
Step 1: create a class which inherits one of our default layout strategies. For this, we chose BottomAlignedOuterHorizontallyStackedAxisLayoutStrategy as the base class.
Breaking this code down:
- The BottomAlignedOuterHorizontallyStackedAxisLayoutStrategy is designed to layout axis on the bottom of the chart (x-Axis) horizontally stacked.
- We override measureAxes and use the default super.measureAxes() function to measure the last three axis. We use a BottomAlignedOuterAxisLayoutStrategy member variable to measure the final axis.
- We override layoutAxes and do the same, combining the result of two strategies.
Applying the strategy like this to a chart:
You can now get the following output.
<div id="scichart-root" ></div>
body { margin: 0; }
#scichart-root { width: 100%; height: 100vh; }
// #region ExampleA
// or for npm ... import { BottomAlignedOuterHorizontallyStackedAxisLayoutStrategy } from "scichart";
const {
  BottomAlignedOuterHorizontallyStackedAxisLayoutStrategy,
  BottomAlignedOuterAxisLayoutStrategy,
  getHorizontalAxisRequiredSize
} = SciChart;

// Example of creating a custom layout manager. First requested here https://www.scichart.com/questions/js/is-it-possible-to-create-two-xaxis-where-one-is-normal-and-the-other-one-is-horizontally-stacked-axis-layout
//
// Axis rendering  happens in 2 phases: measure & layout.
// Axis size and positioning is calculated by an axis layout strategy accordingly to the axisAlignment and isInner properties
// This custom Layout Strategy applies normal layout strategy to the first axis and the stacked strategy to the rest of bottom-aligned outer axes
class CustomAxisLayoutStrategy extends BottomAlignedOuterHorizontallyStackedAxisLayoutStrategy {

  constructor() {
    super();

    /** The strategy used for normal (non-stacked) layout */
    this.defaultBottomOuterAxisLayoutStrategy = new BottomAlignedOuterAxisLayoutStrategy();
  }

  // override measureAxes from the base class
  measureAxes(sciChartSurface,  chartLayoutState,  axes) {
    const [firstAxis, ...stackedAxes] = axes;
    // measure stacked axes and max height (stackedAreaSize) required by them
    super.measureAxes(sciChartSurface, chartLayoutState, stackedAxes);
    const stackedAreaSize = chartLayoutState.bottomOuterAreaSize;

    // measure first axis with the regular logic
    this.defaultBottomOuterAxisLayoutStrategy.measureAxes(
      sciChartSurface,
      chartLayoutState,
      [firstAxis]
    );

    // calculate height required by the first axis and then the total height
    const firstAxisSize = getHorizontalAxisRequiredSize(firstAxis.axisLayoutState);
    chartLayoutState.bottomOuterAreaSize = firstAxisSize + stackedAreaSize;
  }

  // Override layoutAxes from the base class
  layoutAxes(left, top, right, bottom, axes) {
    const [firstAxis, ...stackedAxes] = axes;
    // layout first axis with the regular logic
    this.defaultBottomOuterAxisLayoutStrategy.layoutAxes(
      left, top, right, bottom, [firstAxis]
    );

    // after the layout phase we get axis.viewRect which specifies size and position of an axis
    // and then we can layout rest of the axes with stacked strategy beneath it.
    super.layoutAxes(left, firstAxis.viewRect.bottom, right, bottom, stackedAxes);
  }
}
// #endregion
async function customLayoutManager(divElementId) {
// Demonstrates how to apply a custom layout manager in SciChart.js
const {
SciChartSurface,
NumericAxis,
SciChartJsNavyTheme,
} = SciChart;
// or, for npm, import { SciChartSurface, ... } from "scichart"
// #region ExampleB
const { wasmContext, sciChartSurface } = await SciChartSurface.create(divElementId, {
  theme: new SciChartJsNavyTheme()
});

// Apply your layout manager
sciChartSurface.layoutManager.bottomOuterAxesLayoutStrategy = new CustomAxisLayoutStrategy();

// Create some X Axis
const ID_X_AXIS_1 = "xAxis0";
const ID_X_AXIS_2 = "xAxis1";
const ID_X_AXIS_3 = "xAxis2";
const ID_X_AXIS_4 = "xAxis3";
const options = { drawMajorBands: false, drawMajorGridLines: false, drawMinorGridLines: false };
const xAxis1 = new NumericAxis(wasmContext, {
  id: ID_X_AXIS_1,
  axisTitle: ID_X_AXIS_1,
  drawMajorBands: true,
  drawMajorGridLines: true,
  drawMinorGridLines: true,
});
const xAxis2 = new NumericAxis(wasmContext, {
  id: ID_X_AXIS_2,
  axisTitle: ID_X_AXIS_2,
  ...options,
});
const xAxis3 = new NumericAxis(wasmContext, {
  id: ID_X_AXIS_3,
  axisTitle: ID_X_AXIS_3,
  ...options,
});
const xAxis4 = new NumericAxis(wasmContext, {
  id: ID_X_AXIS_4,
  axisTitle: ID_X_AXIS_4,
  ...options,
});
const yAxis1 = new NumericAxis(wasmContext, {
  axisTitle: "yAxis",
  backgroundColor: "#50C7E022",
  axisBorder: {color: "#50C7E0", borderLeft: 1 },
  axisTitleStyle: { fontSize: 13 },
});

// Add the axis to the chart
sciChartSurface.xAxes.add(xAxis1, xAxis2, xAxis3, xAxis4);
sciChartSurface.yAxes.add(yAxis1);

// To make it clearer what's happening, colour the axis backgrounds & borders
const axisColors = ["#50C7E0", "#EC0F6C", "#30BC9A", "#F48420" ];
sciChartSurface.xAxes.asArray().forEach((xAxis, index) => {
  xAxis.backgroundColor = axisColors[index] + "22";
  xAxis.axisBorder = {color: axisColors[index], borderTop: 1};
  xAxis.axisTitleStyle.fontSize = 13;
});
// #endregion
const {
ZoomPanModifier,
PinchZoomModifier,
ZoomExtentsModifier,
MouseWheelZoomModifier,
FastLineRenderableSeries,
XyDataSeries,
TextAnnotation
} = SciChart;
// Let's add some series to the chart to show how they also behave with axis
const getOptions = (index, offset = 0) => {
const xValues = Array.from(Array(50).keys());
const yValues = xValues.map(x => Math.sin(x * 0.4 + index) + offset);
return {
xAxisId: `xAxis${index}`,
stroke: axisColors[index],
strokeThickness: 3,
dataSeries: new XyDataSeries(wasmContext, { xValues, yValues })
};
};
sciChartSurface.renderableSeries.add(new FastLineRenderableSeries(wasmContext, {...getOptions(0, 1)}));
sciChartSurface.renderableSeries.add(new FastLineRenderableSeries(wasmContext, {...getOptions(1)}));
sciChartSurface.renderableSeries.add(new FastLineRenderableSeries(wasmContext, {...getOptions(2)}));
sciChartSurface.renderableSeries.add(new FastLineRenderableSeries(wasmContext, {...getOptions(3)}));
// We will also add some annotations to explain to the user
sciChartSurface.annotations.add(new TextAnnotation({
text: "Blue series uses xAxis0 and is stretched horizontally",
x1: 0,
y1: 2,
textColor: axisColors[0],
}));
sciChartSurface.annotations.add(new TextAnnotation({
text: "Using xAxis1",
x1: 0,
y1: 1.1,
xAxisId: ID_X_AXIS_2,
textColor: axisColors[1],
}));
sciChartSurface.annotations.add(new TextAnnotation({
text: "Using xAxis2",
x1: 0,
y1: 1.1,
xAxisId: ID_X_AXIS_3,
textColor: axisColors[2],
}));
sciChartSurface.annotations.add(new TextAnnotation({
text: "Using xAxis3",
x1: 0,
y1: 1.1,
xAxisId: ID_X_AXIS_4,
textColor: axisColors[3],
}));
sciChartSurface.chartModifiers.add(
new ZoomPanModifier(),
new PinchZoomModifier(),
new ZoomExtentsModifier(),
new MouseWheelZoomModifier({ applyToSeriesViewRect: false })
);
};
customLayoutManager("scichart-root");
Reversing the Order of Stacked & Stretched Axis
What if you wanted to swap the order of the stretched xAxis and the stacked xAxis?
This is really simple, just modify the layoutAxes function like this.
Now the axis order are swapped, resulting in this output.
<div id="scichart-root" ></div>
body { margin: 0; }
#scichart-root { width: 100%; height: 100vh; }
// or for npm ... import { BottomAlignedOuterHorizontallyStackedAxisLayoutStrategy } from "scichart";
const {
BottomAlignedOuterHorizontallyStackedAxisLayoutStrategy,
BottomAlignedOuterAxisLayoutStrategy,
getHorizontalAxisRequiredSize
} = SciChart;
// Example of creating a custom layout manager. First requested here https://www.scichart.com/questions/js/is-it-possible-to-create-two-xaxis-where-one-is-normal-and-the-other-one-is-horizontally-stacked-axis-layout
//
// Axis rendering happens in 2 phases: measure & layout.
// Axis size and positioning is calculated by an axis layout strategy accordingly to the axisAlignment and isInner properties
// This custom Layout Strategy applies normal layout strategy to the first axis and the stacked strategy to the rest of bottom-aligned outer axes
class CustomAxisLayoutStrategy extends BottomAlignedOuterHorizontallyStackedAxisLayoutStrategy {
constructor() {
super();
/** The strategy used for normal (non-stacked) layout */
this.defaultBottomOuterAxisLayoutStrategy = new BottomAlignedOuterAxisLayoutStrategy();
}
// override measureAxes from the base class
measureAxes(sciChartSurface, chartLayoutState, axes) {
const [firstAxis, ...stackedAxes] = axes;
// measure stacked axes and max height (stackedAreaSize) required by them
super.measureAxes(sciChartSurface, chartLayoutState, stackedAxes);
const stackedAreaSize = chartLayoutState.bottomOuterAreaSize;
// measure first axis with the regular logic
this.defaultBottomOuterAxisLayoutStrategy.measureAxes(
sciChartSurface,
chartLayoutState,
[firstAxis]
);
// calculate height required by the first axis and then the total height
const firstAxisSize = getHorizontalAxisRequiredSize(firstAxis.axisLayoutState);
chartLayoutState.bottomOuterAreaSize = firstAxisSize + stackedAreaSize;
}
// #region ExampleA
// Use the base horizontal stacked layout first, before default layout to switch the order of axis
layoutAxes(left, top, right, bottom, axes) {
  const [firstAxis, ...stackedAxes] = axes;
  // layout stacked axes first
  super.layoutAxes(left, top, right, bottom, stackedAxes);

  // then get the top offset for the normalAxis with stackedAxis.viewRect.bottom
  const stackedAxis = stackedAxes[0]
  this.defaultBottomOuterAxisLayoutStrategy.layoutAxes(
    left,
    stackedAxis.viewRect.bottom,
    right,
    bottom,
    [firstAxis] // normal axis
  );
}
// #endregion
}
async function customLayoutManager(divElementId) {
// Demonstrates how to apply a custom layout manager in SciChart.js
const {
SciChartSurface,
NumericAxis,
SciChartJsNavyTheme,
} = SciChart;
// or, for npm, import { SciChartSurface, ... } from "scichart"
const { wasmContext, sciChartSurface } = await SciChartSurface.create(divElementId, {
theme: new SciChartJsNavyTheme()
});
// Apply your layout manager
sciChartSurface.layoutManager.bottomOuterAxesLayoutStrategy = new CustomAxisLayoutStrategy();
// Create some X Axis
const ID_X_AXIS_1 = "xAxis0";
const ID_X_AXIS_2 = "xAxis1";
const ID_X_AXIS_3 = "xAxis2";
const ID_X_AXIS_4 = "xAxis3";
const options = { drawMajorBands: false, drawMajorGridLines: false, drawMinorGridLines: false };
const xAxis1 = new NumericAxis(wasmContext, {
id: ID_X_AXIS_1,
axisTitle: ID_X_AXIS_1,
drawMajorBands: true,
drawMajorGridLines: true,
drawMinorGridLines: true,
});
const xAxis2 = new NumericAxis(wasmContext, {
id: ID_X_AXIS_2,
axisTitle: ID_X_AXIS_2,
...options,
});
const xAxis3 = new NumericAxis(wasmContext, {
id: ID_X_AXIS_3,
axisTitle: ID_X_AXIS_3,
...options,
});
const xAxis4 = new NumericAxis(wasmContext, {
id: ID_X_AXIS_4,
axisTitle: ID_X_AXIS_4,
...options,
});
const yAxis1 = new NumericAxis(wasmContext, {
axisTitle: "yAxis",
backgroundColor: "#50C7E022",
axisBorder: {color: "#50C7E0", borderLeft: 1 },
axisTitleStyle: { fontSize: 13 },
});
// Add the axis to the chart
sciChartSurface.xAxes.add(xAxis1, xAxis2, xAxis3, xAxis4);
sciChartSurface.yAxes.add(yAxis1);
// To make it clearer what's happening, colour the axis backgrounds & borders
const axisColors = ["#50C7E0", "#EC0F6C", "#30BC9A", "#F48420" ];
sciChartSurface.xAxes.asArray().forEach((xAxis, index) => {
xAxis.backgroundColor = axisColors[index] + "22";
xAxis.axisBorder = {color: axisColors[index], borderTop: 1};
xAxis.axisTitleStyle.fontSize = 13;
});
const { TextAnnotation, EHorizontalAnchorPoint, ECoordinateMode, EAnnotationLayer } = SciChart;
const textOpts = {
xCoordinateMode: ECoordinateMode.Relative,
yCoordinateMode: ECoordinateMode.Relative,
x1: 0.5,
y1: 0.5,
horizontalAnchorPoint: EHorizontalAnchorPoint.Center,
opacity: 0.33,
textColor: "White",
};
sciChartSurface.annotations.add(new TextAnnotation({
text: "Custom Layout Manager Example",
fontSize: 36,
yCoordShift: -50,
... textOpts,
}));
sciChartSurface.annotations.add(new TextAnnotation({
text: "Reversing the order of Stacked and Stretched X-Axis",
fontSize: 20,
... textOpts,
}));
};
customLayoutManager("scichart-root");