
The HorizontalLineAnnotation allows to draw a horizontal line between X1, X2 coordinates at Y1.
Declaring a HorizontalLineAnnotation in code
The following code will declare a HorizontalLineAnnotation and add it to the chart.
This results in the following output:
<div id="scichart-root"></div>
body {
margin: 0;
}
#scichart-root {
width: 100%;
height: 100vh;
}
// #region ExampleA
const {
  HorizontalLineAnnotation,
  NumericAxis,
  SciChartSurface,
  ELabelPlacement,
  SciChartJsNavyTheme,
} = SciChart;

// or for npm import { SciChartSurface, ... } from "scichart"

async function addAnnotationToChart(divElementId) {
  const { wasmContext, sciChartSurface } = await SciChartSurface.create(
    divElementId,
    {
      theme: new SciChartJsNavyTheme(),
    }
  );
  sciChartSurface.xAxes.add(new NumericAxis(wasmContext));
  sciChartSurface.yAxes.add(new NumericAxis(wasmContext));

  // Add a selection of annotations to the chart
  sciChartSurface.annotations.add(
    // Vertically line stretched across the viewport, showing label value = X (9)
    new HorizontalLineAnnotation({
      labelPlacement: ELabelPlacement.Axis,
      showLabel: true,
      stroke: "#FF6600",
      strokeThickness: 2,
      y1: 4,
      axisLabelFill: "#FF6600",
      axisLabelStroke: "#333",
      axisFontSize: 20,
    }),
    // Vertically line with a custom label value
    new HorizontalLineAnnotation({
      labelPlacement: ELabelPlacement.Axis,
      showLabel: true,
      stroke: "#3388FF",
      strokeThickness: 2,
      strokeDashArray: [5, 5],
      y1: 9,
      axisLabelFill: "#3388FF",
      labelValue: "Custom Label",
      axisLabelStroke: "White",
      axisFontSize: 20,
    })
  );
}

addAnnotationToChart("scichart-root");
// #endregion
async function builderExample(divElementId) {
// #region ExampleB
const { chartBuilder, EAnnotationType } = SciChart;

// or for npm import { SciChartSurface, ... } from "scichart"

const { wasmContext, sciChartSurface } = await chartBuilder.build2DChart(
  divElementId,
  {
    annotations: [
      {
        type: EAnnotationType.RenderContextHorizontalLineAnnotation,
        options: {
          labelPlacement: ELabelPlacement.Axis,
          showLabel: true,
          stroke: "#FF6600",
          strokeThickness: 2,
          y1: 4,
          axisLabelFill: "#FF6600",
          axisLabelStroke: "#333",
          axisFontSize: 20,
        },
      },
      {
        type: EAnnotationType.RenderContextHorizontalLineAnnotation,
        options: {
          labelPlacement: ELabelPlacement.Axis,
          showLabel: true,
          stroke: "#3388FF",
          strokeThickness: 2,
          strokeDashArray: [5, 5],
          y1: 9,
          axisLabelFill: "#3388FF",
          labelValue: "Custom Label",
          axisLabelStroke: "White",
          axisFontSize: 20,
        },
      },
    ],
  }
);
// #endregion
}
// Uncomment this to use the builder example //builderExample("scichart-root");
Changing Label Position or Label Value
The label may be placed on the line, or on the axis. Placemement of the label is controlled by the HorizontalLineAnnotation.labelPlacement property, which expects an ELabelPlacement enum.
Valid settings are Axis, Bottom, BottomLeft, BottomRight, Top, TopLeft, TopRight, Left and Right.
For example, setting labelPlacement to ELabelPlacement.TopLeft:
Results in the label being placed on the top left of the line.
<div id="scichart-root"></div>
body {
  margin: 0;
}
#scichart-root {
  width: 100%;
  height: 100vh;
}
const {
HorizontalLineAnnotation,
NumericAxis,
SciChartSurface,
ELabelPlacement,
SciChartJsNavyTheme,
} = SciChart;
// or for npm import { SciChartSurface, ... } from "scichart"
async function addAnnotationToChart(divElementId) {
const { wasmContext, sciChartSurface } = await SciChartSurface.create(
divElementId,
{
theme: new SciChartJsNavyTheme(),
}
);
sciChartSurface.xAxes.add(new NumericAxis(wasmContext));
sciChartSurface.yAxes.add(new NumericAxis(wasmContext));
// #region ExampleA
// Add a selection of annotations to the chart
sciChartSurface.annotations.add(
  // Vertically line stretched across the viewport, showing label value = X (9)
  new HorizontalLineAnnotation({
    labelPlacement: ELabelPlacement.TopRight,
    showLabel: true,
    stroke: "#FF6600",
    strokeThickness: 2,
    y1: 9,
    axisLabelFill: "#FF6600",
    axisLabelStroke: "#333",
    axisFontSize: 20,
  }),
  // Vertically line with a custom label value
  new HorizontalLineAnnotation({
    labelPlacement: ELabelPlacement.TopLeft,
    showLabel: true,
    stroke: "#3388FF",
    strokeThickness: 2,
    strokeDashArray: [5, 5],
    y1: 4,
    axisLabelFill: "#3388FF",
    labelValue: "Custom Label",
    axisLabelStroke: "White",
    axisFontSize: 20,
  })
);
// #endregion
}
addAnnotationToChart("scichart-root");
async function builderExample(divElementId) {
// #region ExampleB
const { chartBuilder, EAnnotationType } = SciChart;

// or for npm import { SciChartSurface, ... } from "scichart"

const { wasmContext, sciChartSurface } = await chartBuilder.build2DChart(
  divElementId,
  {
    annotations: [
      {
        type: EAnnotationType.RenderContextHorizontalLineAnnotation,
        options: {
          labelPlacement: ELabelPlacement.TopRight,
          showLabel: true,
          stroke: "#FF6600",
          strokeThickness: 2,
          y1: 9,
          axisLabelFill: "#FF6600",
          axisLabelStroke: "#333",
          axisFontSize: 20,
        },
      },
      {
        type: EAnnotationType.RenderContextHorizontalLineAnnotation,
        options: {
          labelPlacement: ELabelPlacement.TopLeft,
          showLabel: true,
          stroke: "#3388FF",
          strokeThickness: 2,
          strokeDashArray: [5, 5],
          y1: 4,
          axisLabelFill: "#3388FF",
          labelValue: "Custom Label",
          axisLabelStroke: "White",
          axisFontSize: 20,
        },
      },
    ],
  }
);
// #endregion
}
// Uncomment this to use the builder example //builderExample("scichart-root");
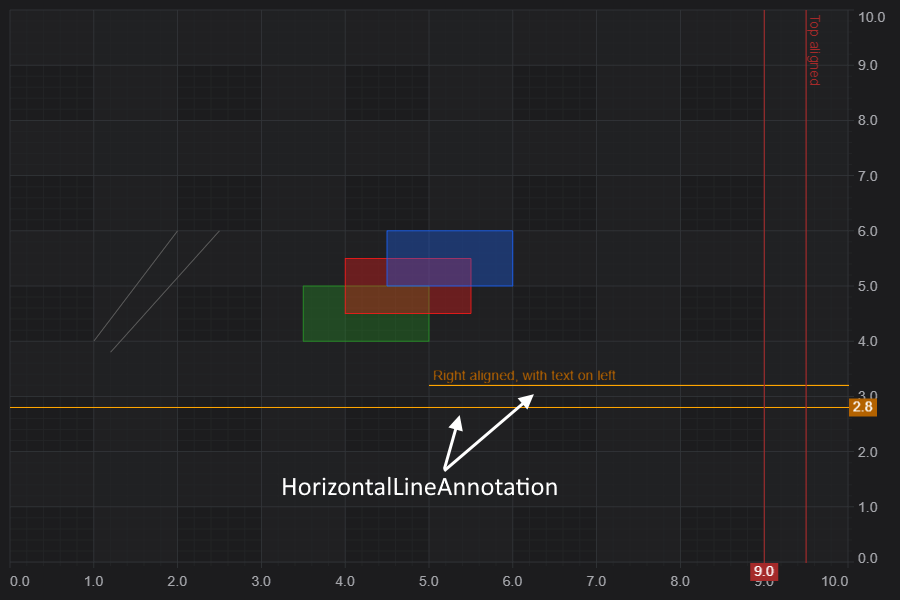
HorizontalAlignment Stretch and Partially Drawn Lines
HorizontalLineAnnotations may be drawn to stretch vertically across the viewport, or to a specific Y-value. To truncate a VerticalLineAnnotation simply specify a y1 coordinate.
For example, the two options are shown below in code:
Result in this output.
<div id="scichart-root"></div>
body {
  margin: 0;
}
#scichart-root {
  width: 100%;
  height: 100vh;
}
// #region ExampleA
const {
  HorizontalLineAnnotation,
  NumericAxis,
  SciChartSurface,
  ELabelPlacement,
  SciChartJsNavyTheme,
} = SciChart;

// or for npm import { SciChartSurface, ... } from "scichart"

async function addAnnotationToChart(divElementId) {
  const { wasmContext, sciChartSurface } = await SciChartSurface.create(
    divElementId,
    {
      theme: new SciChartJsNavyTheme(),
    }
  );
  sciChartSurface.xAxes.add(new NumericAxis(wasmContext));
  sciChartSurface.yAxes.add(new NumericAxis(wasmContext));

  // Add a selection of annotations to the chart
  sciChartSurface.annotations.add(
    // Horizontal line stretched across the viewport, showing label value = Y (9)
    new HorizontalLineAnnotation({
      labelPlacement: ELabelPlacement.Axis,
      showLabel: true,
      stroke: "SteelBlue",
      strokeThickness: 2,
      y1: 9,
      axisLabelFill: "SteelBlue",
      axisFontSize: 20,
    }),
    // Horizontal line with a custom label value partially stretched to X=4
    new HorizontalLineAnnotation({
      showLabel: true,
      stroke: "Orange",
      strokeThickness: 2,
      y1: 6,
      x1: 4,
      axisLabelFill: "Orange",
      axisFontSize: 20,
    })
  );
}

addAnnotationToChart("scichart-root");
// #endregion
async function builderExample(divElementId) {
// #region ExampleB
const { chartBuilder, EAnnotationType } = SciChart;

// or for npm import { SciChartSurface, ... } from "scichart"

const { wasmContext, sciChartSurface } = await chartBuilder.build2DChart(
  divElementId,
  {
    annotations: [
      {
        type: EAnnotationType.RenderContextHorizontalLineAnnotation,
        options: {
          labelPlacement: ELabelPlacement.Axis,
          showLabel: true,
          stroke: "SteelBlue",
          strokeThickness: 2,
          y1: 9,
          axisLabelFill: "SteelBlue",
          axisFontSize: 20,
        },
      },
      {
        type: EAnnotationType.RenderContextHorizontalLineAnnotation,
        options: {
          showLabel: true,
          stroke: "Orange",
          strokeThickness: 2,
          y1: 6,
          x1: 4,
          axisLabelFill: "Orange",
          axisFontSize: 20,
        },
      },
    ],
  }
);
// #endregion
}
// Uncomment this to use the builder example //builderExample("scichart-root");
Styling the HorizontalLineAnnotation
The following properties can be set to style the HorizontalLineAnnotation:
| Property | Description |
| labelPlacement | An enumeration defining where the vertical line label is placed. Default is on axis. |
| labelValue | The label value. By default this will equal the x1 value with text formatting applied by the axis. However it can be overridden to any string |
| showLabel | When true, a label is shown |
| stroke | The stroke color of the vertical line |
| strokeDashArray | |
| strokeThickness | The stroke thickness of the vertical line |
| axisLabelFill | The box fill color for the axis label |
| axisLabelStroke | The text-color for the axis label |
| axisFontFamily | The font family for the axis label text |
| axisFontSize | The font size for the axis label text |