DirectX Compatibility in WPF Charts with SciChart
SciChart now features an optional DirectX10 based renderer. This is currently included as an add-on to the SciChart High Performance […]

Today we are pleased to announce the release of SciChart WPF SDK v9.0! This release brings exciting new chart types, a significantly improved MVVM API, new featured examples, and performance improvements to the SciChart WPF 2D & 3D Chart control suite. For a complete overview of all changes, please see the “What’s New in SciChart WPF v9” documentation article.
SciChart WPF v9 (v9.0.0 build 29196) introduces the Vector Field and Stacked Box Plot chart types, a purely MVVM axis synchronization mechanism, deferred ZoomExtents for MVVM scenarios, faster MVVM axes layout, and new featured demo examples. We outline the main enhancements and features below.
We’ve moved over to a new format for communicating our releases and updates of our popular WPF Chart library, by publishing a rolling changelog of every fix or enhancement in SciChart. You can find the changelogs in the top menu at Developers -> Changelogs -> SciChart WPF ChangeLog
Below is a summary of the main features and changes in this release (v9.0.0 build 29196):
SciChart v9 introduces the VectorFieldRenderableSeries – a new 2D chart type for rendering collections of arrows (vectors) on a plane. Each arrow originates at a data point (X, Y) and extends in the direction and magnitude defined by its displacement components (DX, DY). Vector fields are widely used to visualize directional quantities such as wind, fluid flow, electric fields, or gradient distributions.
Two data series types are provided: UniformVectorFieldDataSeries for vectors on a regular grid (ideal for simulation output and meteorological data), and NonUniformVectorFieldDataSeries for scattered sample points (suitable for sensor readings and particle simulations). Both support polar data input.
Key features of the Vector Field series include:
Three new examples are included in the Examples Demo: a static Vector Field Chart with uniform and non-uniform field types, a Realtime Vector Field Chart with animated flow, and a Realtime Scattered Vector Field Chart demonstrating particle simulation with multiple palette presets.
For more information, see the Vector Field Renderable Series documentation article.
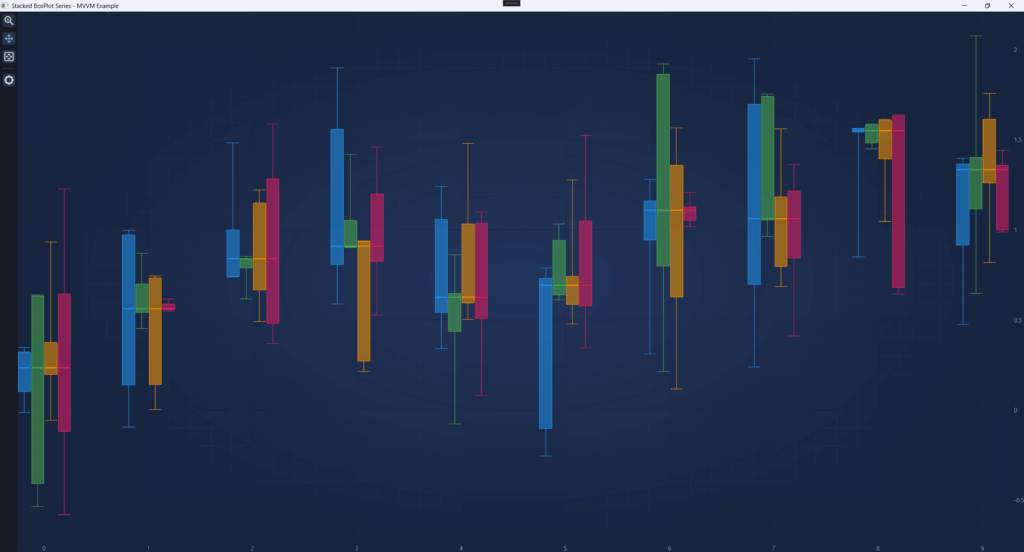
SciChart v9 adds the StackedBoxPlotRenderableSeries – a box plot chart type that supports rendering multiple box plot bars side-by-side at the same X position. This makes it straightforward to compare statistical distributions across categories or experimental conditions.
Like StackedColumnRenderableSeries, the new series uses a StackedGroupId property to control grouping. Series with the same StackedGroupId are laid out side-by-side and the available DataPointWidth is divided equally among all series in the group. The Spacing property controls the pixel gap between adjacent boxes.
StackedBoxPlotRenderableSeries uses the existing BoxPlotDataSeries<TX, TY> for its data model (X, Median, Minimum, LowerQuartile, UpperQuartile, Maximum) and supports full MVVM via StackedBoxPlotRenderableSeriesViewModel.
For more information, see the Stacked Box Plot Renderable Series documentation article.
SciChart v9 introduces a purely MVVM range-synchronization mechanism for linking axis VisibleRanges across multiple charts. This is essential for dashboards where zooming or panning on one chart should update the others, and it requires no code-behind or event wiring.
Every IAxisViewModel now exposes a RangeSyncGroupId property. Axes that share the same non-null group ID are automatically linked: when any axis in the group changes its VisibleRange, the new range is propagated to every other axis in the same group. Propagation is managed internally and requires no manual subscription:
// Create two Y Axes and sync them via the RangeSyncGroupId
c.YAxes.Add(new NumericAxisViewModel { Id = "SpeedY_Time", AxisTitle = "Speed (kph)", RangeSyncGroupId = "GroupSpeedY", RangeSyncSourceOnZoomExtents = true });
c.YAxes.Add(new NumericAxisViewModel { Id = "SpeedY_Dist", AxisTitle = "Speed (kph)", RangeSyncGroupId = "GroupSpeedY" });When synchronized axes represent different physical units (e.g., distance vs. time, or Celsius vs. Fahrenheit), a direct range copy is incorrect. The new IRangeSyncTransform interface solves this: assign a transform to any axis whose units differ from the canonical group unit. The synchronization flow becomes:
Sender range → ToGroupRange() → Canonical group range → FromGroupRange() → Target range
A transformation then can be applied to an axis using the RangeSyncTransform property:
// Create two X Axes and sync them via the RangeSyncGroupId
// Apply a range transformation via the RangeSyncTransform
c.XAxes.Add(new NumericAxisViewModel { Id = "DistX", AxisTitle = "Distance (m)", RangeSyncGroupId = "GroupXDomain", RangeSyncSourceOnZoomExtents = true });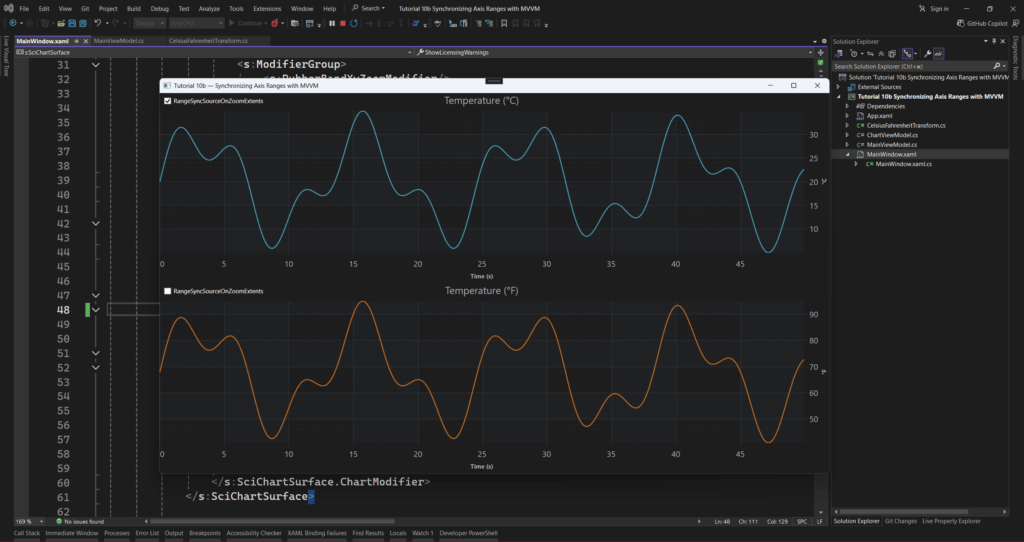
c.XAxes.Add(new NumericAxisViewModel { Id = "TimeX", AxisTitle = "Time (s)", RangeSyncGroupId = "GroupXDomain", RangeSyncTransform = new InterpolatingRangeSyncTransform(_timeX, _distanceX) });During ZoomExtents, range synchronization is automatically suppressed to prevent charts from fighting over conflicting extents. For scenarios where ZoomExtents on one chart should propagate to all synchronized peers, set RangeSyncSourceOnZoomExtents = true on the authoritative axis. That axis’s computed extents are then broadcast to the sync group, transformed through each peer’s IRangeSyncTransform as usual.
A new tutorial, “Tutorial 10b: Synchronizing Axis Ranges with MVVM”, demonstrates RangeSyncGroupId, IRangeSyncTransform with a Celsius/Fahrenheit conversion, and RangeSyncSourceOnZoomExtents.
For more information, see the MVVM Axis Synchronization API documentation article.
In MVVM applications, Series ViewModels and their data are typically created before the SciChartSurface has attached the view models to actual RenderableSeries. Calling SciChartSurface.ZoomExtents() at this point has no effect because the chart surface is not yet ready.
SciChart v9 adds ZoomExtentsWhenReady() – an extension method on IRenderableSeriesViewModel (and IEnumerable<IRenderableSeriesViewModel>) that defers ZoomExtents until all specified series are attached to a surface and ready for manipulation. This can be called directly from a ViewModel constructor with no reference to the SciChartSurface:
RenderableSeries.Add(new LineRenderableSeriesViewModel
{
    DataSeries = ds,
    Stroke = Colors.CornflowerBlue
});

// Deferred ZoomExtents – fires once the surface is ready
RenderableSeries.ZoomExtentsWhenReady();
An async overload, ZoomExtentsWhenReadyAsync(), is also available for scenarios where the caller needs to know whether the operation succeeded or timed out.
For more information, see the MVVM ZoomExtents API documentation article.
The MVVM Axes API has received significant performance optimization in v9, delivering approximately 30% faster layout and rendering for charts that use AxesBinding. This improvement is especially noticeable in dashboard-style applications with many axes per surface and multiple tabs or views that trigger frequent visual tree recreation.
A new featured example demonstrates how to use SciChart 3D to create a custom 3D mesh, used to visualize a directional antenna radiation pattern. The example combines the 3D mesh with interactive 2D charts: a fan chart and gain coverage heatmap on the left, the 3D radiation pattern in the centre, and E-plane and H-plane polar charts on the right.
The 3D scene includes a custom mesh entity rendered from a polar gain dataset, interactive phi and theta cut rings with adjustable opacity, and angle indicator arcs with text labels. Toolbar sliders control the cut angles, and draggable annotation lines on the gain heatmap are two-way bound to the sliders for seamless cross-chart interaction.
The Racing Telemetry Dashboard is a new featured multi-chart example that visualizes telemetry data from motorsport sessions. The dashboard displays synchronized distance-domain and time-domain charts showing speed, throttle, brake, steering, gear, and RPM data.
The example showcases several SciChart v9 features working together: the new MVVM Axis Synchronization API with RangeSyncGroupId links all distance-domain and time-domain axes, IRangeSyncTransform converts between the distance and time domains in real time, and the legend is built entirely in MVVM with selection binding directly to RenderableSeries.
SciChart v9 includes new examples in the SciChart Examples Demo, a new tutorial in the Sandbox, and new documentation articles.
We have added minor improvements and enhancements throughout the library. More details can be found in the SciChart WPF Changelog.
Although there are some breaking changes in the SciChart WPF v9 SDK (vs version 8.x), we are hoping that for most customers SciChart WPF v9 is a drop-in replacement.
In the majority of cases, SciChart WPF v9 should be a drop-in replacement for customers of SciChart WPF v8, with a very high proportion of backward compatible APIs. A list of breaking changes that we know about are found below. If you find more and require assistance, please contact us and our team will be happy to help.
SciChart WPF v9 (v9.0.0 build 29196) is available by:
We welcome your feedback! Please let us know what you think about our new features, examples and improvements. You can contact our friendly, helpful team at any time!
Related Posts
![]()
Queens Award for Innovation
Proud winners of the Queens Award for Innovation, 2019. Awarded on account of our innovative graphics engine which underpins the SciChart library and enables our world-beating charting performance
![]()
National Business Awards
Highly Commended for Lloyds National Business Awards, 2019. Awarded on account of our innovative graphics engine and impressive customer base
![]()
National Technology Awards
Awarded “Healthcare Tech of the Year” at the 2025 National Technology Awards – a top UK recognition for breakthrough innovation in technology.

Reviews
SciChart has received hundreds of verified, 3rd party reviews