SciChart’s Cross-Platform Vision Complete!
SciChart has achieved a great deal in the past year, notably the pace of large releases has really increase in […]
Just six weeks after the release of SciChart.js v5.0, we have another minor update for you: SciChart.js v5.1.0.
In this release, we’ve built upon what we previously created and have added several minor features & improvements to the library.
Find out what’s new below!
We’ve listened to user feedback and have created the first version of an official Blazor Nuget package for SciChart.js. This is now available on NuGet and is open to testing, user feedback.
We’ve managed to solve a major performance bottleneck in using JavaScript Charts in MS Blazor by developing an efficient Wasm-to-wasm bridge for sharing memory, avoiding the painfully slow serialization of Blazor memory to JSON for sharing to JavaScript chart libraries. The result: you can now plot millions of data-points in Blazor Charts using SciChart.Blazor!
The first version contains 2D charts only (3D coming soon!), and a selection of axis, annotations and interactivity modifiers. Try out the package and do give us your feedback.

{The description goes here. Please enter a short description with two to three paragraphs} … Continue reading Blog: SciChart for Blazor is now in Alpha. Plot millions of data-points in Blazor apps with SciChart, using a Razor-like syntax, and efficient Wasm to Wasm memory bridging.
setMetadata() and setMetadataAt(), allowing per-point metadata to be updated and trigger chart invalidation correctly.useNativeText is enabled, modifier axis labels (e.g. cursor/rollovermodifier) now render using the same native text path as axis labels, so font families match exactly.DataPointSelectionModifier – Fixed drag-selection not including the last data point in the selection range. (SCJS-2412)DateTimeNumericAxis tick precision – Fixed DateTimeNumericAxis generating poor tick values at sub-second precisions (e.g. showing 876ms, 939ms instead of 800ms, 900ms). (SCJS-2408)minAge threshold to avoid excessive pruning overhead.PolarAxisRenderer memory leak – Fixed a memory leak in the polar axis renderer; the old renderer is now properly deleted when the axis type changes. (SCJS-2444)The SciChart team is incredibly busy at the moment and knocking out features at a rate of knots!
We have some exciting announcements to make soon, a selection of which / preview can be found below:
SciChart WPF has featured a CompositeAnnotation type (group of annotations) for many years, to enable more complex shapes such as measurement rulers, custom groups of annotations and even Fibonacci Retracements.
We’ve ported this to SciChart.js and will be releasing it soon, along with a library of built-in drawing tools for financial trading apps.
SciTrader is an open source library built on top of SciChart to allow financial charting capabilities in iOS / Android applications. We’re now in the process of porting this to JavaScript, using SciChart.js, however we’ll be adding some additional capabilities:
When this is ready, we’ll be publishing a new package and announcing a release to our userbase.
A recent feature request – enable selection & hover in 3D charts is being worked on as we speak. We’ve then upgraded the existing Interactive Waterfall Spectral Chart demo to use this new feature.
This will be released soon, as we’re still working on the feature. Watch a quick preview below:
A massive merge / unification of our C++ code across Windows, Mac, Linux, iOS/Android and Web browsers (via WebAssembly) is underway, and approximately 90% complete. This will bring to SciChart a single unified C++ engine codebase that can run on any platform (desktop, mobile, browser), any operating system (Windows, Linux, macOS, iOS/Android OS) and in all the SciChart products (WPF, iOS, Android, Js).
The benefit of this is – feature sharing – we’re now able to port in features from WPF to JS and vice versa quickly, plus bring advanced rendering with newer graphics APIs to the browser.
Part of this work has been updating the C++ engine to compile in WebAssembly not only to WebGL, but WebGPU (with WebGL fallback). This will bring about not only performance enhancements but previously impossible features, such as this amazing volumetric rendering of 3D MRI data you see below:
WebGPU offers a lot of enhancements over WebGL for rendering complex 3D scenes in JavaScript. It’s supported in all major browsers (Chrome, Safari, Firefox) post ~2023 and of course, we’ll ensure that when released, SciChart.js maintains it’s fallback to WebGL 2.
An official MCP server for SciChart is in the testing phase. Building on our popular in-house SciChart-GPT chat assistant, the MCP will be available to current customers of SciChart, and is designed to serve code samples, documentation & API info directly to your preferred AI coding tools, to enhance the AI coding experience.
Soon we’ll be publishing a Beta with instructions to integrate the scichart-mcp to Claude, Gemini, Cursor, Copilot and more.
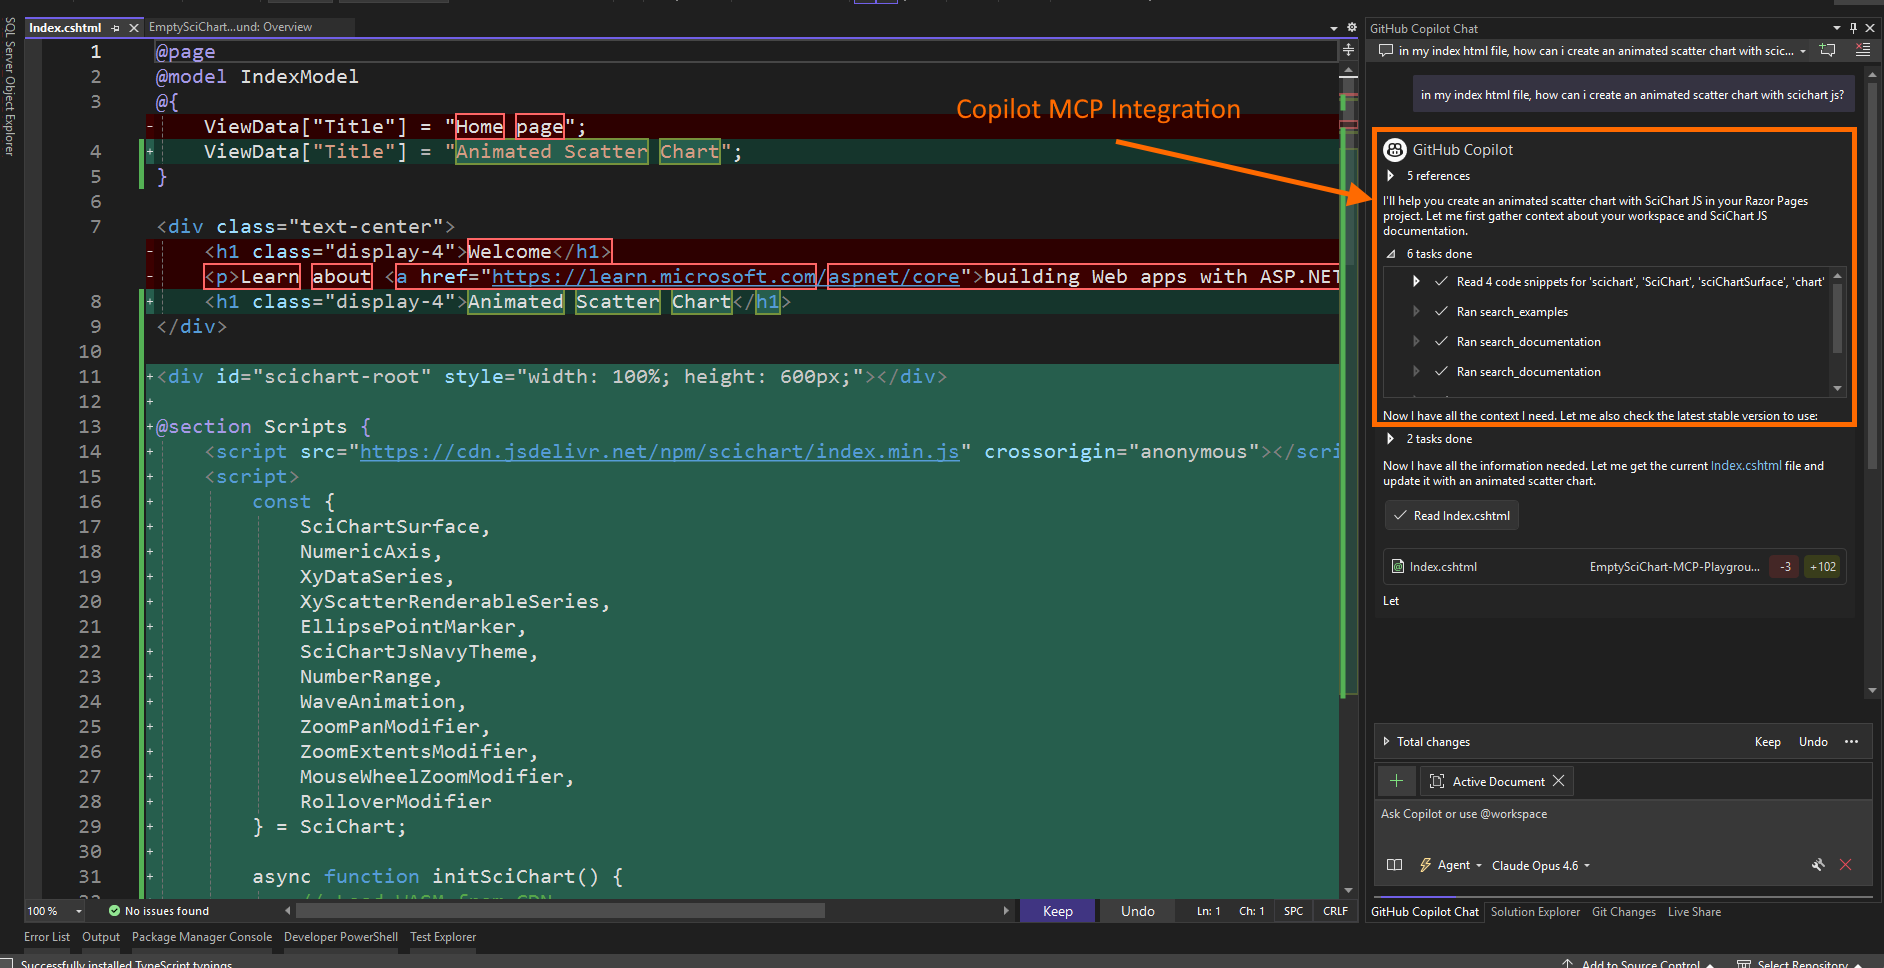
In early testing, this greatly improves the output of AI coding tools by providing concrete API calls, best-practice guidance, live code examples and documentation from our website, reducing hallucinations and improving productivity of using AI tools.
SciChart is working hard to ensure that our documentation, demos, examples and tooling are ready for the AI coding age, and this enhancement will provide a big leap in productivity for our users.
Contact us to learn more
SciChart.js is a JavaScript Chart Library designed for complex, mission critical applications. Now with a FREE community edition. If you have a question or would like to learn more about our products & services, please contact us:
Related Posts
![]()
Queens Award for Innovation
Proud winners of the Queens Award for Innovation, 2019. Awarded on account of our innovative graphics engine which underpins the SciChart library and enables our world-beating charting performance
![]()
National Business Awards
Highly Commended for Lloyds National Business Awards, 2019. Awarded on account of our innovative graphics engine and impressive customer base
![]()
National Technology Awards
Awarded “Healthcare Tech of the Year” at the 2025 National Technology Awards – a top UK recognition for breakthrough innovation in technology.

Reviews
SciChart has received hundreds of verified, 3rd party reviews