Last updated: 1st of May, 2025We are pleased to announce the release of SciChart v5.2.0. Build 11680 . This is a new version which includes new features and big number of bug fixes and improvements. It is strongly advised for users of SciChart v5.x to upgrade to this version, which is a drop-in replacement.
What’s New in SciChart WPF v5.2.0?
Breaking changes
There are some breaking changes, that will affect users of SciChart.DirectX, Custom Themes and AnnotationCreationModifierMVVM. Please read on. To the rest of the users this version is backward compatible.
- users of SciChart.DirectX will now need to update SharpDX to v4.2.0
- users who have custom themes will need to add the following three theme keys to their Theme Resource dictionary with color values of their choice:
<!– 3DChart Specific values –>
#FF333333
Transparent
#E1202123
- EffectManager.Instance.EnableDropShadows has been made obsolete, to solve a memory leak caused by WPF {x:Static} MarkupExtension binding. This property is now simply EffectManager.EnableDropShadows. Binding to this property may be achieved through the .NET 4.5 Static Property binding mechanism.
- AnnotationCreationModifierMVVM.AnnotationType is changed to – AnnotationCreationModifierMVVM.AnnotationViewModelType and AnnotationCreationModifierMVVM.AnnotationsColection to – AnnotationCreationModifierMVVM.AnnotationViewModelsCollection.
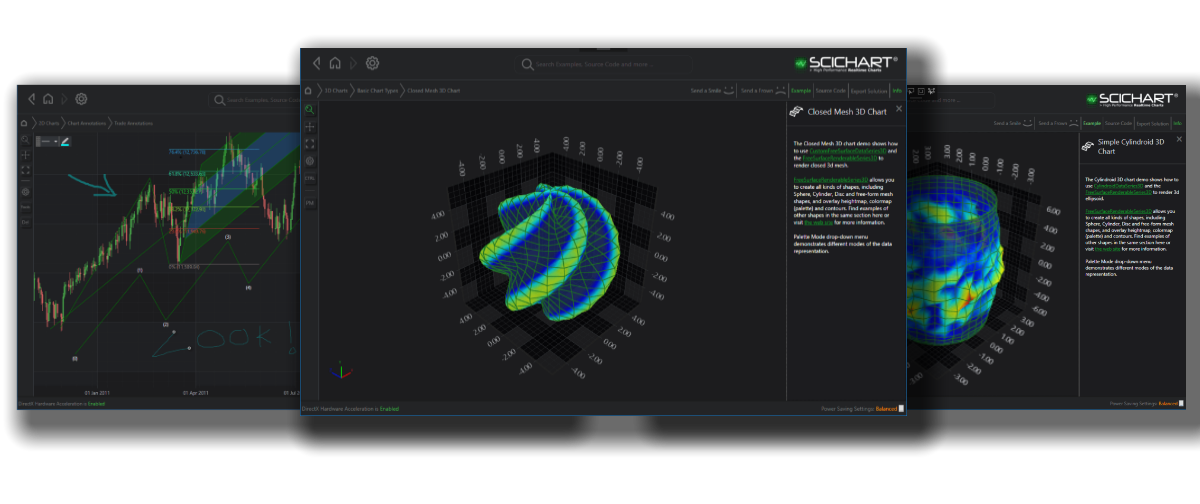
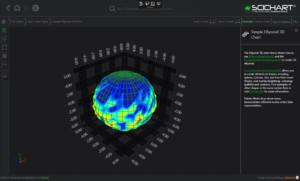
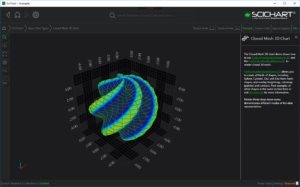
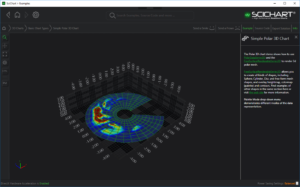
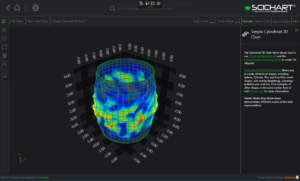
WPF New Chart Type: Free Surface Mesh 3D
The Free Surface 3D Chart types are a set of 3D Charts that represent the data by plotting the surface in a custom shape in 3D space. The Free Surface 3D Chart types allows to plot both types of charts that constrained to its basic 3D primitive and unconstrained. In other words it allows you to plot charts of all kinds of shapes, including Sphere, Cylinder, Disc and free-form mesh shapes.
Please this chart type examples below:
This chart type allows customization of a chart by overlaying heightmap, colormap (palette) and contours.
- The 3D FreeSurfaceRenderableSeries3Dcan be rendered in realtime as well. The Free Surface Mesh colors and palette can be udpated by supplying a MeshColorPalette.
Many mesh options are available such as Wireframe, SolidMesh, Solid with Wireframe, and many paletting options such as Solid Cells, Interpolated Cells and Textured.
Please see an example below and read documentation for SciChart WPF Realtime 3D Geoid:
This new 3D Chart type is available to all customers of SciChart WPF SDK Professional, SDK Enterprise and 3D Professional who are in support subscription, free of charge.
WPF New Feature: Trade Annotations (Drawing tools)
With WPF v.5.2 SciChart features a rich DrawingTools API, includes new drawing tools that will allow you to easily place annotations that are widely used in financial or trading domains at your application .
Now you can add following out of the box
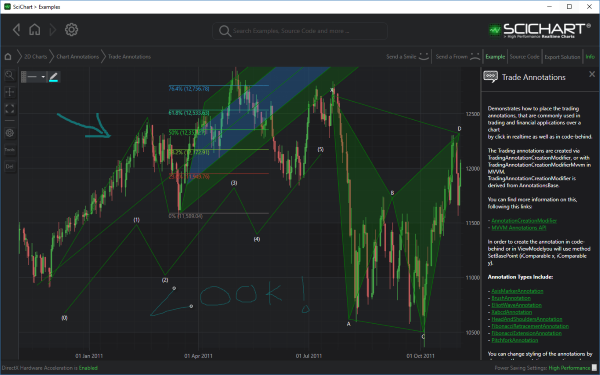
All the drawing tools are customarily, you may change stroke thickness, line style and colors, etc.
All new drawing tools are in the SciChart.DrawingTools.dll package and are available to all customers of SciChart WPF SDK Professional, SDK Enterprise and 2D Enterprise who are in support subscription, free of charge.
Bug Fixes and Improvements
- Fixed a memory leak in DirectX Renderer plugin when PointMarker changed often or new series with PointMarkers created often, cached textures for the marker were not released.
- Updated SciChart licensing module to use FIPS compliant algorithms so that SciChart can be used in high security settings
- Increased performance of series load by only applying Dropshadow effects to series markers and tooltips in the SciChart XAML Templates when the EffectManager.EnableDropShadows flag is set *and* the tooltip is visible
- Fixed issue where creating MVVM AxisViewModel after SciChartSurface is loaded causes Axis.IsPrimaryAxis to be false and AxisAlignment incorrect, which resulted in blank chart
- Added missing properties to MVVM Bindings for AxisBase3D: CursorTextFormatting, AxisTitle, VisibleRange
- Added a property to AxisBase3D.AxisPlaneBackgroundFill which when set (default Transparent) fills in the entire axis wall in a solid colour
- Fixed hit test and tooltip on RenderableSeries3D failing when obscured by a custom BaseSceneEntity
- Fixed null reference if Direct3D11RenderSurface.RenderSurfaceLoaded is called after Dispose
- Fixed a memory leak where chart was kept alive if LegendModifier was used.
- Fixed issue with DataPointSelectionModifier, when XAxisId where set from ViewModel
- Fixed SC-4601: DataPointSelectionModifier seems to select incorrect columns in StackedColumnsSeries
- Fixed the issue with ZoomHistoryManager when MVVM API is used and AxisBinding is not working yet
- Fixed SC-4543: ZoomHistoryManager does not fire RangeHistoryChanged when ClearAllHistory is called
- Fixed the issue when ZoomHistoryManager would throw when MVVM API is used and AxisBinding had not worked yet
- Fixed Assertion Failed. Martix stackoverflow
- SC3D-472: Added true AntiAliasing for text objects in SciChart 3D which fixes white text edge problem
- Fixed SC3D-473: flickering that happens when min and max values are very different by not resetting the min and max again when calculating each frame
- Fixed SC-4633: when there is no height map texture, the waterfall was broken
- Fixed SurfaceMeshRenderableSeries3D crashes for specific dataset
- Ported Fix for Direct3D10RenderSurface memory leak from v4.x branch to v5.x. Required some modifications due to changes in v 5.x branch
- Added some documentation for performance / memory leak debugging
- Fixed an issue DoubleScaleDiscontinuousAxis would not invalidate when the DrawAxisScaleBands property changes
- Fixed binding error in default Axis3D style (MVVM)
- Fixed bug where last pane in SciChart Group with SciStockChart does not accept mousewheel
- Fixed PinchZoomModifier issues
- Fixed drawing of StackedMountains for VerticalChart
- Fixed ExtremeResampler crash on Arabic Win10
- Fixed IsSelected flag on PointMetadata3D not updating the chart
- Fixed SC-4502: PointMetaData3D.Parent does not set on XyzDataSeries3D append and insert
- Fixed cross thread violation crash when FastHeatmapRenderableSeries is instantiated in an STAThread
- Fixed an issue when LogarithmicAxis would throw in TickProvider when used in an MVVM scenario
- Fixed SC-4611: LogarithmicAxis and FastColumn didn’t worked correctly
- Fixed SC-4564: AutoRange=”Always” broken for logarithmic stacked column series
- Fixed FibonacciRetracementAnnotation when used with MVVM
- Improved AxisBandsProvider API to be more convenient
- Added internal TextBox property in TextAnnotation
- Fixed 3D charts with DateTime Z axis issues
- Added Labstylecharts 3D Chart example
- Fixed SC-4612: CompositeAnnotations as long as Drawing Tools disappear after the export
- Fixed SC-4465: SeriesInfo3D provides no access metadata – cannot show point metadata in tooltips
- Fixed SC-4626: tweaked C# resamplers as well to correctly handle case when data unsorted and evenly spaced when using Auto mode
- Fixed SC-4471: TooltipModifier doesn’t consider size of PointMarkers for ScatterSeries
- Fixed VisibleRangeLimit when it should not clip range if VisibleRange min more then VisibleRangeLimit Max when LimitMode is min (and vice versa)
- Added SciChartGroup.VerticalChartGroup property to SynchronizeMouseAcrossCharts.xaml
- Fixed an issue when StackedColumns would throw when ZoomExtents called and series had not been attached yet
Where to Get SciChart WPF v5.2.0?
SciChart WPF v5.2.0 is available from:
Please ensure you uninstall the previous version(s) of SciChart before installing v5.2.0 as this can prevent some issues in the upgrade process!
GET SCICHART WPF v5.2.0
Best regards,
SciChart team