Get Started: Tutorials, Examples > Tutorials (JavaScript / npm / Webpack) > Tutorial 08 - Adding Multiple Axis
Tutorial 08 - Adding Multiple Axis

In Tutorial 7 - Adding Tooltips and Legends, we showed you how to add tooltips and legends to a JavaScript Chart using SciChart.js. Now we are going to learn how to add a second YAxis.

SciChart supports unlimited axes. This unlocks different possibilities, such as rotated (vertical) charts.

Source code for this tutorial can be found at SciChart.JS.Examples Github Repository


In this tutorial, we are going to add a second YAxis to the chart. We are going to show how to register line series and annotations on the second axis. We are also going to show how to ensure Axis drag behavior works on both axis.

Adding a Second Y Axis

The procedure to add a second axis to a SciChartSurface is pretty much the same as with one axis with one difference. You must assign a unique string ID to all axes if there is more than one.

To see the axis to appear to the either side of a chart, you set axisAlignment to EAxisAlignment.Left, EAxisAlignment.Right, etc. EAxisAlignment is an enumeration.

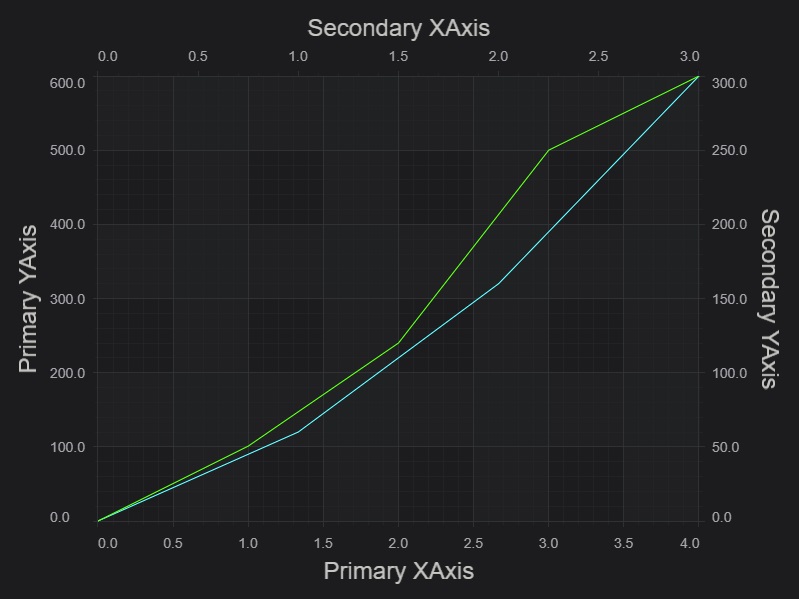
Let's start by placing two Y-Axis on the left and right of the chart, and two X-Axis on the top and bottom.

index.js
Copy Code
import {SciChartSurface} from "scichart/Charting/Visuals/SciChartSurface";
import {NumericAxis} from "scichart/Charting/Visuals/Axis/NumericAxis";
import {EAxisAlignment} from "scichart/types/AxisAlignment";
import {NumberRange} from "scichart/Core/NumberRange";

async function initSciChart() {
    const {sciChartSurface, wasmContext} = await SciChartSurface.create("scichart-root");

    // Create an X,Y Axis and add to the chart
    const xAxis = new NumericAxis(wasmContext, {
        axisTitle: "Primary XAxis",
        axisAlignment: EAxisAlignment.Bottom,
    });
    const xAxis2 = new NumericAxis(wasmContext, {
        axisTitle: "Secondary XAxis",
        id: "XAxis_2",
        axisAlignment: EAxisAlignment.Top,
    });
    const yAxis = new NumericAxis(wasmContext,
    {
        axisTitle: "Primary YAxis",
        axisAlignment: EAxisAlignment.Left,
    });
    const yAxis2 = new NumericAxis(wasmContext,
    {
        axisTitle: "Secondary YAxis",
        id: "YAxis_2",
        axisAlignment: EAxisAlignment.Right,
    });
    sciChartSurface.xAxes.add(xAxis);
    sciChartSurface.xAxes.add(xAxis2);
    sciChartSurface.yAxes.add(yAxis);
    sciChartSurface.yAxes.add(yAxis2);
}

initSciChart();

Now we can see the primary and secondary X & Y axis in our application:

Registering RenderableSeries on an Axis

If there are several Y or X axes, you need to register other chart parts, like RenderableSeries and Annotations, on a particular axis to be measured against its scale.

We do this by setting the RenderableSeries.xAxisId and yAxisId properties. These must match the Id set on the axis themselves. If you leave an xAxisId/yAxisId unset, it will default to DEFAULT_AXIS_ID.

index.js
Copy Code
...
import {FastLineRenderableSeries} from "scichart/Charting/Visuals/RenderableSeries/FastLineRenderableSeries";
import {XyDataSeries} from "scichart/Charting/Model/XyDataSeries";

async function initSciChart() {
    ...
    // Create first series and bind to the first Y axis
    const lineSeries1 = new FastLineRenderableSeries(wasmContext, { stroke: "#33F9FF", xAxisId: "XAxis_2" , yAxisId: "YAxis_2" });
    sciChartSurface.renderableSeries.add(lineSeries1);
    lineSeries1.dataSeries = new XyDataSeries(wasmContext, {xValues: [0, 1, 2, 3], yValues:[0, 60, 160, 300]});
    // Create second series and bind to the second Y axis
    const lineSeries2 = new FastLineRenderableSeries(wasmContext, { stroke: "#33ff33"});
    sciChartSurface.renderableSeries.add(lineSeries2);
    lineSeries2.dataSeries = new XyDataSeries(wasmContext, {xValues: [0, 1, 2, 3, 4], yValues:[0, 101, 240, 500, 600]});
}

This results in the chart shown below:

Registering Annotations on an Axis

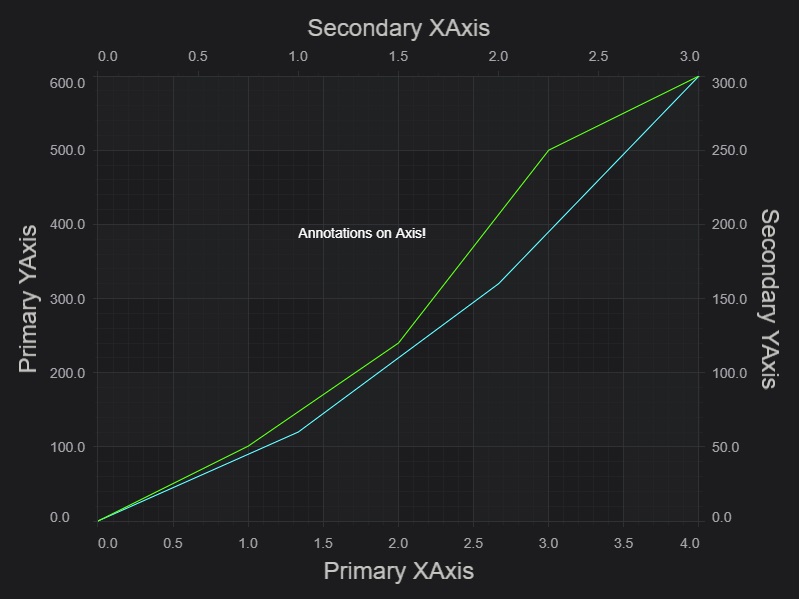
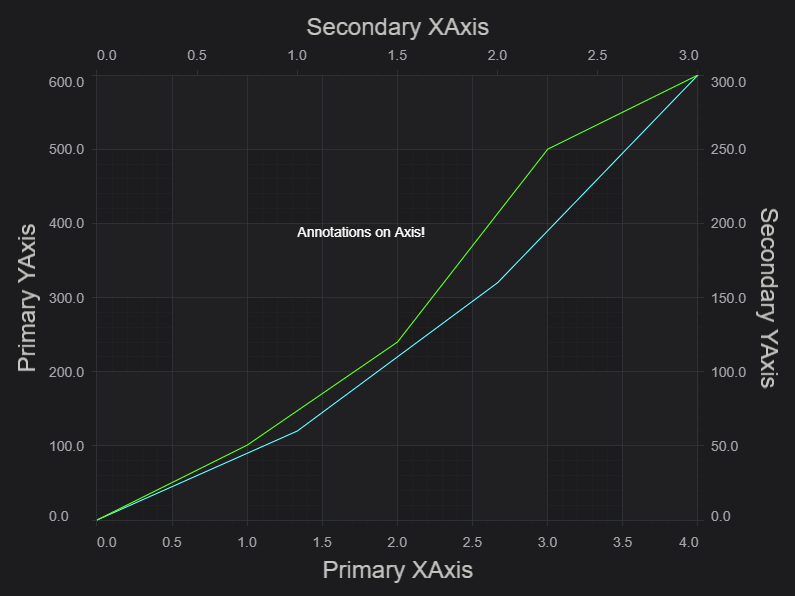
Annotations can also be added to a multi-axis chart, and registered with a specific axis pair. Add a TextAnnotation as follows.

index.js
Copy Code
...
import {TextAnnotation} from "scichart/Charting/Visuals/Annotations/TextAnnotation";

async function initSciChart() {
    ...
    sciChartSurface.annotations.add(new TextAnnotation({
        text: "Annotations on Axis!",
        x1: 1,
        y1: 200,
        xAxisId: "XAxis_2",
        yAxisId: "YAxis_2"
    }));
}

Now we can see a TextAnnotation in the middle of the chart, bound to the Secondary X,Y axis at X,Y={1, 200}

Adding Axis Drag Behaviour

If you want to visualize more clearly which series or annotation is bound to which axis pair, add some Axis Drag behaviours

index.js
Copy Code
...
import {YAxisDragModifier} from "scichart/Charting/ChartModifiers/YAxisDragModifier";
import {XAxisDragModifier} from "scichart/Charting/ChartModifiers/XAxisDragModifier";

async function initSciChart() {
    ...
    // Add a drag modifier for Y Axis
    sciChartSurface.chartModifiers.add(new YAxisDragModifier());
    sciChartSurface.chartModifiers.add(new XAxisDragModifier());
}

Now if we hover over an Y Axis, click the mouse button and drag the scaling occurs. Moreover we can notice that the scaling only affects the series and annotations attached to that axis.


Further Reading

Here is related documentation for further reading:

See Also