import { appTheme } from "../../../theme";
// import CustomImage from "./scichart-logo-white.png";
import { rocketSvg } from "./416398_exploration_fuel_nasa_rocket_space_icon";
import {
SciChartSurface,
NumericAxis,
NumberRange,
ZoomPanModifier,
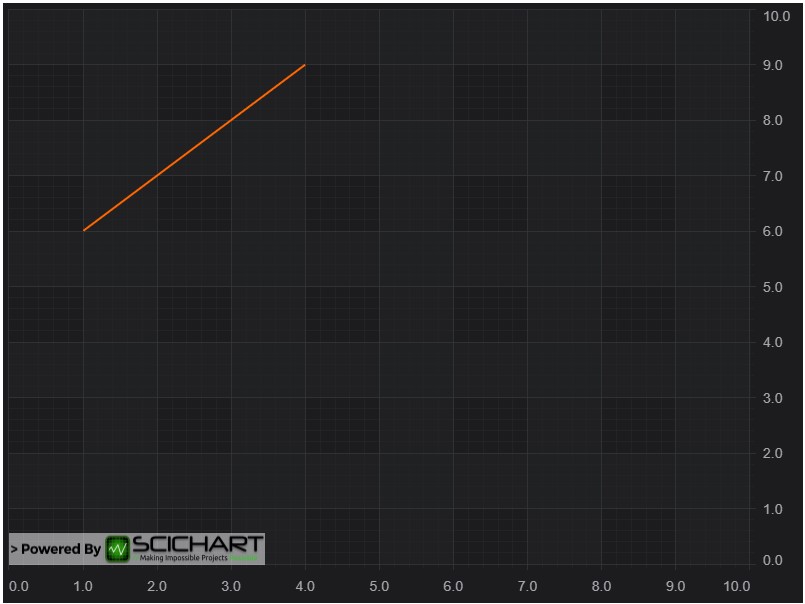
LineAnnotation,
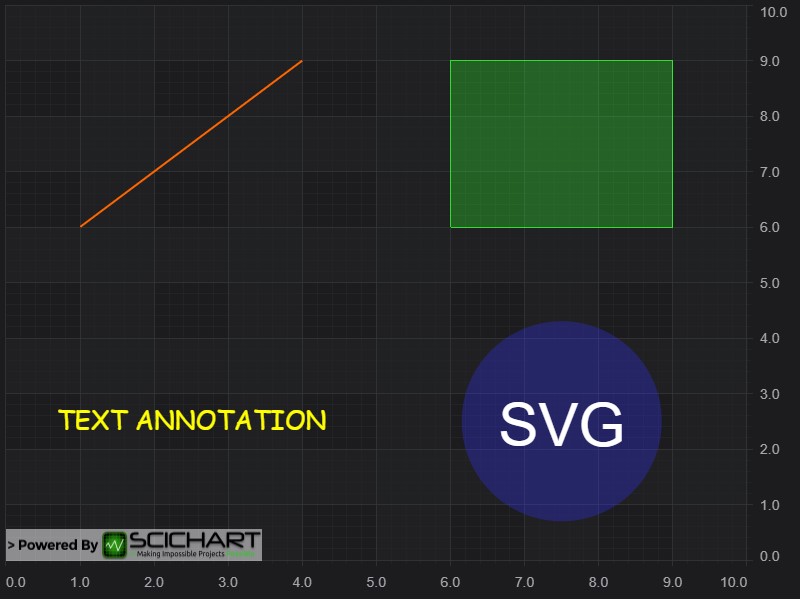
BoxAnnotation,
CustomAnnotation,
TextAnnotation,
EHorizontalAnchorPoint,
EVerticalAnchorPoint,
ECoordinateMode,
EAnnotationLayer,
IAnnotation,
HorizontalLineAnnotation,
ELabelPlacement,
VerticalLineAnnotation,
GenericAnimation,
EWrapTo,
NativeTextAnnotation,
} from "scichart";
export const drawExample = (CustomImage: string) => async (rootElement: string | HTMLDivElement) => {
// Create a SciChartSurface
const { sciChartSurface, wasmContext } = await SciChartSurface.create(rootElement, {
theme: appTheme.SciChartJsTheme,
});
// Create an XAxis and YAxis
const xAxis = new NumericAxis(wasmContext);
xAxis.visibleRange = new NumberRange(0, 10);
sciChartSurface.xAxes.add(xAxis);
const yAxis = new NumericAxis(wasmContext);
yAxis.visibleRange = new NumberRange(0, 10);
sciChartSurface.yAxes.add(yAxis);
// Optional: Add some interactivity modifiers
sciChartSurface.chartModifiers.add(new ZoomPanModifier({ enableZoom: true }));
const textColor = appTheme.ForegroundColor;
const stroke = appTheme.VividSkyBlue;
const strokeDashArray = [3, 3];
// Add TextAnnotations in the top left of the chart
//
const text1 = new TextAnnotation({
text: "Chart Annotations are Powerful!",
fontSize: 24,
x1: 0.3,
y1: 9.7,
textColor,
});
const text2 = new TextAnnotation({ text: "You can create text", fontSize: 18, x1: 2, y1: 9, textColor });
const nativeText = new NativeTextAnnotation({
text: "New! NativeText supports multi line with automatic wrapping, and rotation",
fontSize: 18,
x1: 7,
x2: 10,
y1: 9,
textColor,
wrapTo: EWrapTo.Annotation,
});
// Add Dashed line and anchor text center/right/left annotations
//
const lineDash = new LineAnnotation({ x1: 5, x2: 5, y1: 8.5, y2: 7, stroke, strokeDashArray });
const textAlignCenter = new TextAnnotation({
text: "Anchor Text Centered",
x1: 5,
y1: 8,
textColor,
horizontalAnchorPoint: EHorizontalAnchorPoint.Center, // anchorpoints control where the X,Y coord is located
verticalAnchorPoint: EVerticalAnchorPoint.Bottom,
});
const textAlignRight = new TextAnnotation({
text: "Anchor Text Right",
x1: 5,
y1: 7.8,
textColor,
horizontalAnchorPoint: EHorizontalAnchorPoint.Right,
verticalAnchorPoint: EVerticalAnchorPoint.Top,
});
const textAlignLeft = new TextAnnotation({
text: "or Anchor Text Left",
x1: 5,
y1: 7.5,
textColor,
horizontalAnchorPoint: EHorizontalAnchorPoint.Left,
verticalAnchorPoint: EVerticalAnchorPoint.Top,
});
// Watermark with CoordinateMode Relative
//
const textWatermark = new TextAnnotation({
text: "Create Centered Watermarks",
x1: 0.5,
y1: 0.5,
textColor,
opacity: 0.3,
horizontalAnchorPoint: EHorizontalAnchorPoint.Center,
verticalAnchorPoint: EVerticalAnchorPoint.Center,
fontSize: 48,
fontWeight: "Bold",
xCoordinateMode: ECoordinateMode.Relative, // xCoordinateMode relative allows 0..1 to correspond to viewport left/right
yCoordinateMode: ECoordinateMode.Relative, // yCoordinateMode relative allows 0..1 to correspond to viewport top/bottom
});
// Lines
//
const textLines = new TextAnnotation({ fontSize: 13, text: "You can draw lines", x1: 0.3, y1: 6.3, textColor });
const line1 = new LineAnnotation({ stroke, strokeThickness: 2, x1: 1, x2: 2, y1: 4, y2: 6 });
const line2 = new LineAnnotation({ stroke, strokeThickness: 2, x1: 1.2, x2: 2.5, y1: 3.8, y2: 6 });
// Boxes
//
const textBoxes = new TextAnnotation({ fontSize: 13, text: "Draw Boxes with/without alignment", x1: 3.3, y1: 6.3 });
const box1 = new BoxAnnotation({
fill: appTheme.VividGreen + "33",
stroke: appTheme.VividGreen,
strokeThickness: 1,
x1: 3.5,
x2: 5,
y1: 3.9,
y2: 4.9,
});
const box2 = new BoxAnnotation({
fill: appTheme.VividSkyBlue + "33",
strokeThickness: 0,
x1: 0,
x2: 1,
y1: 4.4,
y2: 5.4,
xCoordinateMode: ECoordinateMode.Relative, // xCoordinateMode relative allows stretching a box horizontally to fit viewport
});
const box3 = new BoxAnnotation({
fill: appTheme.VividPink + "33",
stroke: appTheme.VividPink,
strokeThickness: 1,
x1: 4,
x2: 5.5,
y1: 5,
y2: 6,
});
// Custom shapes (Buy Sell arrow markers)
//
const textCustomShapes = new TextAnnotation({ fontSize: 13, text: "Or custom shapes using SVG", x1: 7, y1: 6.3 });
const customAnnotationBuyMarker = getBuyMarkerAnnotation(8, 6);
const customAnnotationSellMarker = getSellMarkerAnnotation(7.5, 5.5);
// Images and Vectors (Icons) SVG
//
const textImage = new TextAnnotation({
x1: 0.3,
y1: 3,
text: "Add images",
textColor,
verticalAnchorPoint: EVerticalAnchorPoint.Bottom,
});
const image = getImageAnnotation(0.3, 2.8, CustomImage, 241, 62);
// Vectors (SVG)
const testCustomSvg = new TextAnnotation({
x1: 3.3,
y1: 3,
text: "Add Vectors and Icons (SVG)",
textColor,
verticalAnchorPoint: EVerticalAnchorPoint.Bottom,
});
const customSvgAnnotation = new CustomAnnotation({ x1: 4.5, y1: 2.8, svgString: rocketSvg });
// Vertical or Horizontal lines with axis Label
//
const textVerticalLine = new TextAnnotation({
x1: 6.7,
y1: 3,
text: "Add Vertical/Horizontal Thresholds",
textColor,
verticalAnchorPoint: EVerticalAnchorPoint.Bottom,
});
const horizontalLineStretched = new HorizontalLineAnnotation({
labelPlacement: ELabelPlacement.Axis,
showLabel: true,
stroke,
strokeThickness: 3,
axisLabelFill: stroke,
axisLabelStroke: appTheme.ForegroundColor,
y1: 1, // The Y-value of the HorizontalLineAnnotation
});
const verticalLineStretched = new VerticalLineAnnotation({
labelPlacement: ELabelPlacement.Axis,
showLabel: true,
stroke,
strokeThickness: 3,
x1: 9, // Tye x-value of the VerticalLineAnnotation
axisLabelFill: stroke,
axisLabelStroke: appTheme.ForegroundColor,
});
// // Axis Markers
// const axisMarker = new AxisMarkerAnnotation({
// y1: 5.2,
// fontSize: 13,
// fontStyle: "Bold"
// });
const allAnnotations = [
text1,
text2,
nativeText,
lineDash,
textAlignLeft,
textAlignRight,
textAlignCenter,
textCustomShapes,
textWatermark,
textLines,
line1,
line2,
textBoxes,
box1,
box2,
box3,
textImage,
image,
testCustomSvg,
customSvgAnnotation,
textVerticalLine,
verticalLineStretched,
horizontalLineStretched,
customAnnotationBuyMarker,
customAnnotationSellMarker,
// customAnnotationSvg
];
// Add all the annotations to the chart
sciChartSurface.annotations.add(...allAnnotations);
// Just for fun, let's animate some animations using Scichart's GenericAnimation feature
const duration = 1000;
const delay = 800;
sciChartSurface.addAnimation(
addTypewriterEffect(duration, 0, text1),
addTypewriterEffect(duration, delay, text2),
addFadeEffect(duration, delay * 2, lineDash, textAlignCenter, textAlignLeft, textAlignRight),
addTypewriterEffect(duration, delay * 3, textAlignCenter),
addTypewriterEffect(duration, delay * 4, textAlignLeft),
addTypewriterEffect(duration, delay * 5, textAlignRight),
addTypewriterEffect(duration, delay * 2, nativeText),
addRotateEffect(duration, delay * 4, nativeText),
addFadeEffect(duration, delay * 6, textWatermark),
addFadeEffect(duration, delay * 7, textLines, line1, line2),
addFadeEffect(duration, delay * 8, textBoxes, box1, box2, box3),
addFadeEffect(duration, delay * 9, textCustomShapes, customAnnotationBuyMarker, customAnnotationSellMarker),
addFadeEffect(duration, delay * 10, textImage, image),
addFadeEffect(duration, delay * 11, testCustomSvg, customSvgAnnotation),
addTypewriterEffect(duration, delay * 12, textVerticalLine),
addFadeEffect(duration, delay * 12, textVerticalLine, verticalLineStretched, horizontalLineStretched)
);
return { sciChartSurface, wasmContext };
};
const addFadeEffect = (duration: number, delay: number, ...annotations: IAnnotation[]) => {
return new GenericAnimation<number>({
from: 0,
to: annotations[0].opacity,
onAnimate: (from: number, to: number, progress: number) => {
annotations.forEach((a) => (a.opacity = to * progress));
},
duration,
delay,
setInitialValueImmediately: true,
});
};
const addTypewriterEffect = (duration: number, delay: number, textAnnotation: { text: string }) => {
return new GenericAnimation<string>({
from: "",
to: textAnnotation.text,
onAnimate: (from: string, to: string, progress: number) => {
const length = Math.floor(to.length * progress);
textAnnotation.text = to.substring(0, length);
},
duration,
delay,
setInitialValueImmediately: true,
});
};
const addRotateEffect = (duration: number, delay: number, textAnnotation: NativeTextAnnotation) => {
return new GenericAnimation<number>({
from: 0,
to: 30,
onAnimate: (from: number, to: number, progress: number) => {
const angle = to * progress;
textAnnotation.rotation = angle;
},
duration,
delay,
});
};
const getBuyMarkerAnnotationSvgString = `<svg id="Capa_1" xmlns="http://www.w3.org/2000/svg">
<g transform="translate(-53.867218,-75.091687)">
<path style="fill:#1cb61c;fill-opacity:0.34117647;stroke:#00b400;stroke-width:1px;stroke-linecap:butt;stroke-linejoin:miter;stroke-opacity:1"
d="m 55.47431,83.481251 c 7.158904,-7.408333 7.158904,-7.408333 7.158904,-7.408333 l 7.158906,7.408333 H 66.212668 V 94.593756 H 59.053761 V 83.481251 Z"/>
</g>
</svg>`;
// Returns a CustomAnnotation that represents a buy marker arrow
// The CustomAnnotation supports SVG as content. Using Inkscape or similar you can create SVG content for annotations
const getBuyMarkerAnnotation = (x1: number, y1: number): CustomAnnotation => {
return new CustomAnnotation({
x1,
y1,
verticalAnchorPoint: EVerticalAnchorPoint.Top,
horizontalAnchorPoint: EHorizontalAnchorPoint.Center,
svgString: getBuyMarkerAnnotationSvgString,
});
};
const getSellMarkerAnnotationSvgString = `
<svg id="Capa_1" xmlns="http://www.w3.org/2000/svg" >
<g transform="translate(-54.616083,-75.548914)">
<path style="fill:${appTheme.VividRed};fill-opacity:0.33;stroke:${appTheme.VividRed};stroke-width:1px;stroke-linecap:butt;stroke-linejoin:miter;stroke-opacity:1"
d="m 55.47431,87.025547 c 7.158904,7.408333,7.158904,7.408333 7.158904,7.408333 L 69.79212, 87.025547 H 66.212668 V 75.913042 h -7.158907 v 11.112505 z"
/>
</g>
</svg>`;
const getImageAnnotation = (x1: number, y1: number, image: any, width: number, height: number): CustomAnnotation => {
return new CustomAnnotation({
x1,
y1,
verticalAnchorPoint: EVerticalAnchorPoint.Top,
horizontalAnchorPoint: EHorizontalAnchorPoint.Left,
svgString: `<svg width="${width}" height="${height}" xmlns="http://www.w3.org/2000/svg" style="background-color:transparent">
<image href="${image}" height="${height}" width="${width}"/>
</svg>`,
});
};
// Returns a CustomAnnotation that represents a sell marker arrow
// The CustomAnnotation supports SVG as content. Using Inkscape or similar you can create SVG content for annotations
const getSellMarkerAnnotation = (x1: number, y1: number): CustomAnnotation => {
return new CustomAnnotation({
x1,
y1,
verticalAnchorPoint: EVerticalAnchorPoint.Bottom,
horizontalAnchorPoint: EHorizontalAnchorPoint.Center,
svgString: getSellMarkerAnnotationSvgString,
});
};