Get Started: Tutorials, Examples > Tutorials (JavaScript / npm / Webpack) > Tutorial 02 - Adding Series and Data
Tutorial 02 - Adding Series and Data

In the previous tutorial we explained how to setup a project with a simple chart using SciChart.js. In this tutorial, we are going to show you how to add some data and a line series to the chart.

Source code for this tutorial can be found at SciChart.Js.Examples Github Repository

Adding Series to the Chart

In SciChart, there are special classes called RenderableSeries that are responsible for drawing different chart types, such as lines (FastLineRenderableSeries), columns (FastColumnsRenderableSeries), candlestick series (FastCandlestickRenderableSeries), filled area (FastMountainRenderableSeries), heat maps (FastUniformHeatmapRenderableSeries) etc...

Adding a Line Plot to the Chart

In this tutorial, we are going to add some Line series onto the chart.

First, we will add a FastLineRenderableSeries and add this to the SciChartSurface.renderableSeries collection.

Next, we create an XyDataSeries - which is the type which stores the data, and can accept dynamic updates (real-time updates) and manipulation of data. We will assign the dataseries to the FastLineRenderableSeries.

Try the code below:

Simple Line Chart
Copy Code
import {SciChartSurface} from "scichart/Charting/Visuals/SciChartSurface";
import {NumericAxis} from "scichart/Charting/Visuals/Axis/NumericAxis";
import {FastLineRenderableSeries} from "scichart/Charting/Visuals/RenderableSeries/FastLineRenderableSeries";
import {XyDataSeries} from "scichart/Charting/Model/XyDataSeries";

async function initSciChart() {
    // Create the SciChartSurface in the div 'scichart-root'
    // The SciChartSurface, and webassembly context 'wasmContext' are paired. This wasmContext
    // instance must be passed to other types that exist on the same surface.
    const {sciChartSurface, wasmContext} = await SciChartSurface.create("scichart-root");
    // Create an X,Y Axis and add to the chart
    const xAxis = new NumericAxis(wasmContext);
    const yAxis = new NumericAxis(wasmContext);
    sciChartSurface.xAxes.add(xAxis);
    sciChartSurface.yAxes.add(yAxis);
    // Declare a DataSeries
    const xyDataSeries = new XyDataSeries(wasmContext);
    xyDataSeries.append(1, 2);
    xyDataSeries.append(3,4);
    // Add a line series to the SciChartSurface
    const lineSeries = new FastLineRenderableSeries(wasmContext);
    lineSeries.strokeThickness = 3;
    lineSeries.stroke = "rgba(255,0,0,1)";
    lineSeries.dataSeries = xyDataSeries;
    sciChartSurface.renderableSeries.add(lineSeries);
    // zoom to fit
    sciChartSurface.zoomExtents();
}
initSciChart();

Ensure you also have the index.html set, which must contain a div with id="scichart-root" (or whatever you pass to SciChartSurface.create)

index.html
Copy Code
<html lang="en-us">
    <head>
        <meta charset="utf-8" />
        <meta content="text/html; charset=utf-8" http-equiv="Content-Type" />
        <title>SciChart.js Tutorial 2</title>
        <script async type="text/javascript" src="bundle.js"></script>
        <style>
            body { font-family: 'Arial'}
        </style>
    </head>
    <body>
        <h1>Hello SciChart.js world!</h1>
        <!-- the Div where the SciChartSurface will reside -->
        <div id="scichart-root" style="width: 100%; height: 600px;"></div>
    </body>
</html>

You should get this result: 

Simple JavaScript Line Chart with SciChart.js

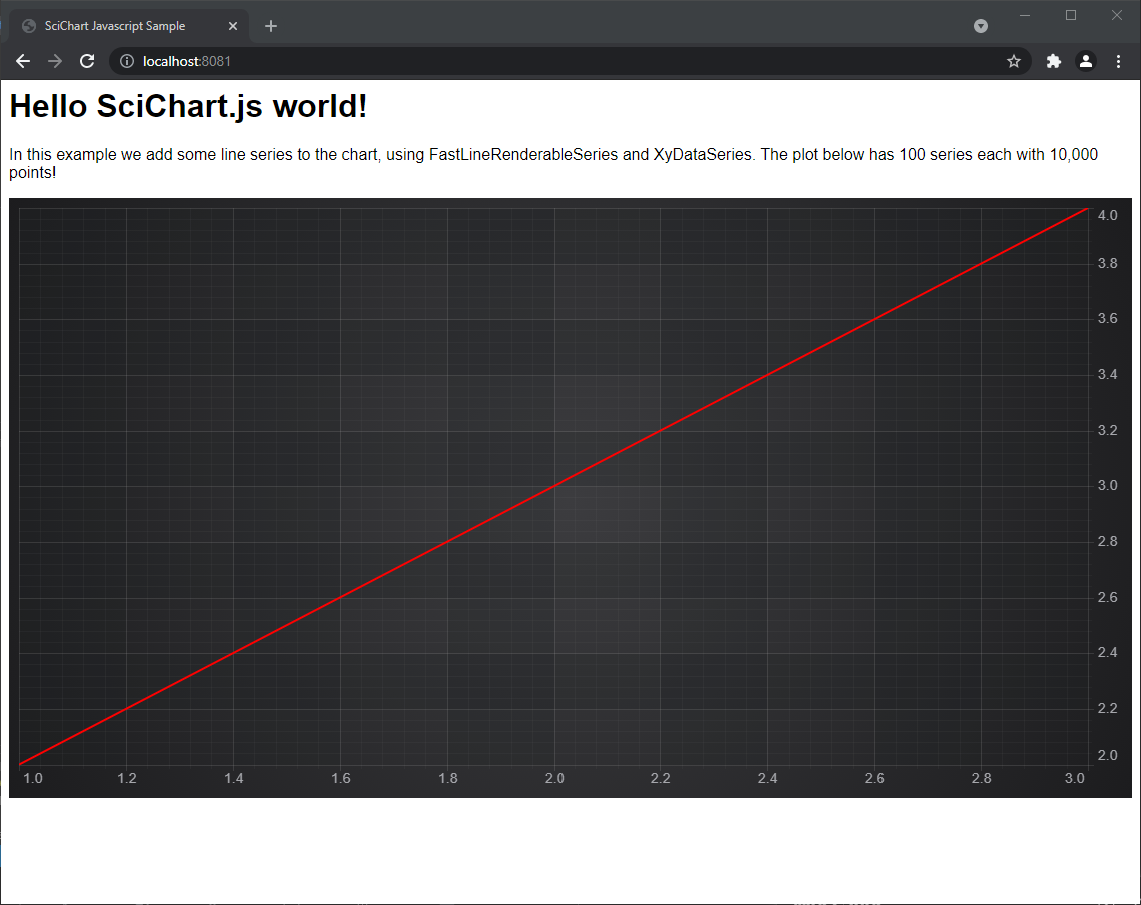
We've added a line series to the chart, styled it red, and added two data-points. Hardly ground-breaking, but it's a start!

Let's take this up a notch in the second part of the tutorial, by adding 100 series, each with 10,000 data-points.

Adding 100 Series, with 10,000 Datapoints to the Chart

We can take this a little bit further, by adding 100 series each with 10,000 datapoints to the Chart, for a total of one million data-points. SciChart's specialty is High Performance, Realtime Charts, and that means you can add large amounts of data to our JavaScript chart component with ease.

Modify the code in index.js to the following:

100 Series x 10k points example
Copy Code
import {SciChartSurface} from "scichart/Charting/Visuals/SciChartSurface";
import {NumericAxis} from "scichart/Charting/Visuals/Axis/NumericAxis";
import {XyDataSeries} from "scichart/Charting/Model/XyDataSeries";
import {FastLineRenderableSeries} from "scichart/Charting/Visuals/RenderableSeries/FastLineRenderableSeries";
async function initSciChart() {
    // LICENSING //
    // Set your license code here
    // You can get a trial license key from https://www.scichart.com/licensing-scichart-js/
    // Purchased license keys can be viewed at https://www.scichart.com/profile
    //
    // e.g.
    //
    // SciChartSurface.setRuntimeLicenseKey("YOUR_RUNTIME_KEY");
    //
    // Also, once activated (trial or paid license) having the licensing wizard open on your machine
    // will mean any or all applications you run locally will be fully licensed.
    // Create the SciChartSurface in the div 'scichart-root'
    // The SciChartSurface, and webassembly context 'wasmContext' are paired. This wasmContext
    // instance must be passed to other types that exist on the same surface.
    const {sciChartSurface, wasmContext} = await SciChartSurface.create("scichart-root");
    // Create an X,Y Axis and add to the chart
    const xAxis = new NumericAxis(wasmContext);
    const yAxis = new NumericAxis(wasmContext);
   
    sciChartSurface.xAxes.add(xAxis);
    sciChartSurface.yAxes.add(yAxis);   
   
    // Create 100 dataseries, each with 10k points
    for (let seriesCount = 0; seriesCount < 100; seriesCount++) {       
        const xyDataSeries = new XyDataSeries(wasmContext);
        const opacity = (1 - ((seriesCount / 120))).toFixed(2);
        // Populate with some data
        for(let i = 0; i < 10000; i++) {
            xyDataSeries.append(i, Math.sin(i* 0.01) * Math.exp(i*(0.00001*(seriesCount+1))));
        }
        // Add and create a line series with this data to the chart
        // Create a line series       
        const lineSeries = new FastLineRenderableSeries(wasmContext, {
            dataSeries: xyDataSeries,
            stroke: `rgba(176,196,222,${opacity})`,
            strokeThickness:2
        });
        sciChartSurface.renderableSeries.add(lineSeries);
    }
}
initSciChart();

This code adds 100 series in a loop, each with 10,000 data-points using the XyDataSeries.append method. The mathematical function in there is just to create a nice looking waveform.

We create a FastLineRenderableSeries for each trip around the outer loop and this time use the constructor parameters to set the dataSeries, stroke and strokeThickness properties.

This is the result below:


JavaScript Chart with Big Data (1 million points) with SciChart.js

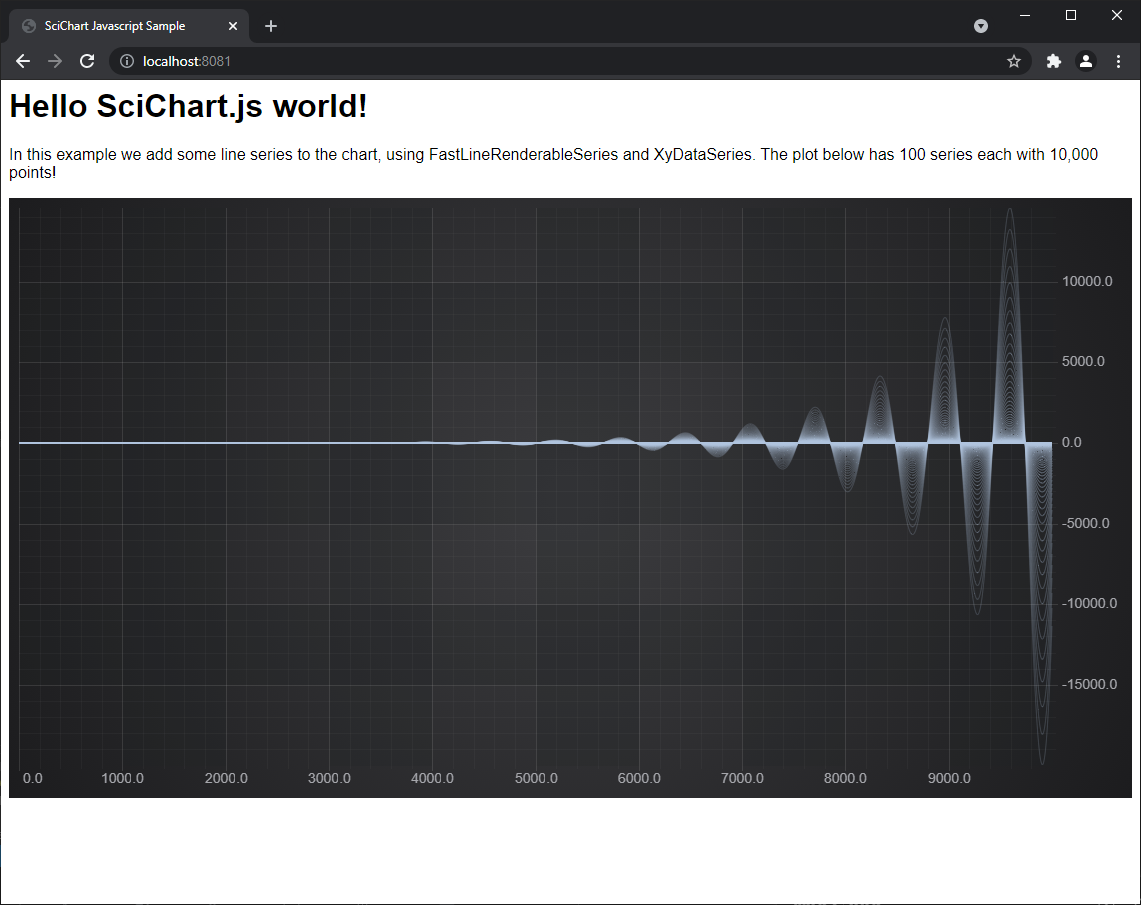
There you go! One million data-points in a JavaScript Chart using SciChart.js!

Join us for Tutorial 3 where we will be adding zooming and panning behaviour to the chart.

A Note on Licensing SciChart.

The SciChart.js control comes with a fully-functional 30-day trial. You will need to apply a trial license to the applications that you build, including the tutorial.

A license key can be applied following the instructions at www.scichart.com/licensing-scichart-js.

See Also