In the previous tutorial we explained how to add zooming and panning behavior to a JavaScript Chart using SciChart.js. In this tutorial, we are going to show you how to add realtime updates.
Creating the Base Application
SciChart has the concept of RenderableSeries and DataSeries. RenderableSeries present the data, while DataSeries hold the X,Y data and manage updates.
Let's start the tutorial with some basic code like this to declare a SciChartSurface with an X,Y axis, and a two series:
Static chart code |
Copy Code
|
---|---|
import {SciChartSurface} from "scichart/Charting/Visuals/SciChartSurface"; import {NumericAxis} from "scichart/Charting/Visuals/Axis/NumericAxis"; import {XyDataSeries} from "scichart/Charting/Model/XyDataSeries"; import {FastLineRenderableSeries} from "scichart/Charting/Visuals/RenderableSeries/FastLineRenderableSeries"; import {XyScatterRenderableSeries} from "scichart/Charting/Visuals/RenderableSeries/XyScatterRenderableSeries"; import {EllipsePointMarker} from "scichart/Charting/Visuals/PointMarkers/EllipsePointMarker"; async function initSciChart() { // LICENSING // // Set your license code here // You can get a trial license key from https://www.scichart.com/licensing-scichart-js/ // Purchased license keys can be viewed at https://www.scichart.com/profile // // e.g. // // SciChartSurface.setRuntimeLicenseKey("YOUR_RUNTIME_KEY"); // // Also, once activated (trial or paid license) having the licensing wizard open on your machine // will mean any or all applications you run locally will be fully licensed. // Create the SciChartSurface in the div 'scichart-root' // The SciChartSurface, and webassembly context 'wasmContext' are paired. This wasmContext // instance must be passed to other types that exist on the same surface. const {sciChartSurface, wasmContext} = await SciChartSurface.create("scichart-root"); // Create an X,Y Axis and add to the chart const xAxis = new NumericAxis(wasmContext); const yAxis = new NumericAxis(wasmContext); sciChartSurface.xAxes.add(xAxis); sciChartSurface.yAxes.add(yAxis); // Create a Scatter series, and Line series and add to chart const scatterSeries = new XyScatterRenderableSeries(wasmContext, { pointMarker: new EllipsePointMarker(wasmContext, { width: 7, height: 7, fill: "White", stroke: "SteelBlue" }), }); const lineSeries = new FastLineRenderableSeries(wasmContext, { stroke: "#4083B7", strokeThickness: 2 }); sciChartSurface.renderableSeries.add(lineSeries, scatterSeries); // Create and populate some XyDataSeries with static data // Note: you can pass xValues, yValues arrays to constructors, and you can use appendRange for bigger datasets const scatterData = new XyDataSeries(wasmContext, { dataSeriesName: "Cos(x)" }); const lineData = new XyDataSeries(wasmContext, { dataSeriesName: "Sin(x)" }); for(let i = 0; i < 1000; i++) { lineData.append(i, Math.sin(i*0.1)); scatterData.append(i, Math.cos(i*0.1)); } // Assign these dataseries to the line/scatter renderableseries scatterSeries.dataSeries = scatterData; lineSeries.dataSeries = lineData; } initSciChart(); |
Index.html |
Copy Code
|
---|---|
<html lang="en-us"> <head> <meta charset="utf-8" /> <meta content="text/html; charset=utf-8" http-equiv="Content-Type" /> <title>SciChart.js Tutorial 5 - Zooming, Panning with Realtime Updates</title> <script async type="text/javascript" src="bundle.js"></script> <style> body { font-family: 'Arial'} </style> </head> <body> <h1>Hello SciChart.js world!</h1> <p>In this example we explore charts with real-time updates in SciChart.js</p> <!-- the Div where the SciChartSurface will reside --> <div id="scichart-root" style="width: 800px; height: 600px;"></div> </body> </html> |
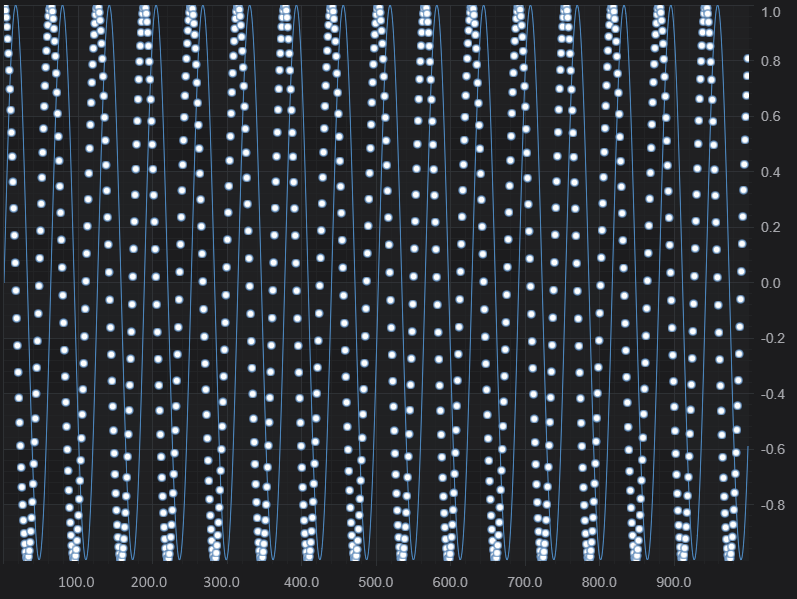
This code above creates a Scatter series, a Line series, appends some static data. You should now be looking at this if you npm start and run the application:
Part 1 - Updating Data Values
Now let's update some data-values in JavaScript to see real-time changes to the chart.
We will use setTimeout to create a timer and call xyDataSeries.update() to change the data. SciChart automatically redraws when the data is changed.
Static chart code |
Copy Code
|
---|---|
// Add the following code right before the end of initSciChart() function let phase = 0.0; const updateDataFunc = () => { // update the datapoints in the dataseries // Note updateRange() passing in array is higher performance for larger datasets for(let i = 0; i < 1000; i++) { lineData.update(i, Math.sin(i * 0.1 + phase)); scatterData.update(i, Math.cos(i * 0.1 + phase)); } phase += 0.01; // Repeat at 60Hz setTimeout(updateDataFunc, 1/60); }; updateDataFunc(); |
Breaking this down, we're using the DataSeries API to manipulate the data. Specifically, dataSeries.update(), which updates a Y-value at a specific index. There are also functions to append, appendRange, insert, insertRange, remove, removeRange and clear, which will remove all data. Any changes to the DataSeries immediately reflect in the chart as SciChart is a fully reactive, dynamic JavaScript chart component.
Now run the application, you should see this!
Part 2 - Appending Data Values
As well as using dataSeries.update(), you can also use dataSeries.append() to add new data-values to the end of a DataSeries. Make some changes in your updateDataFunc() as follows:
Static chart code |
Copy Code
|
---|---|
// Replace the updateDataFunc right before the end of initSciChart() function const updateDataFunc = () => { // Append another data-point to the chart. We use dataSeries.count() // to determine the current length before appending const i = lineData.count(); lineData.append(i, Math.sin(i * 0.1)); scatterData.append(i, Math.cos(i * 0.1)); // ZoomExtents after appending data. // Also see XAxis.AutoRange, and XAxis.VisibleRange for more options sciChartSurface.zoomExtents(); // Repeat at 60Hz setTimeout(updateDataFunc, 1/60); // Warning, this will repeat forever, it's not best practice! }; updateDataFunc(); |
Now run the application again. You sould see the series growing larger as new data is appended.
By default, when you append data, SciChart does not resize the viewport to fit the new data. In the code sample above we have called sciChartSurface.zoomExtents() to fit the data.
Other options to manipulate the viewport can be seen at the pages Axis Ranging - AutoRange and Axis Ranging - Setting and Getting VisibleRange.
Part 3 - Scrolling Realtime Charts
What if you wanted to scroll as new data was appended? You have a few choices.
- If you simply want to scroll the viewport, you can manipulate XAxis.visibleRange (see Getting and Setting VisibleRange) as you append new data.
- If you want to be memory efficient and discard old data, you can use dataSeries.removeAt, or dataSeries.removeRange to remove old values as well.
We're going to show you how to scroll data in a JavaScript chart below.
Scrolling the Chart via XAxis.visibleRange
To scroll in SciChart.js, all we have to do is manipulate the XAxis.visibleRange. This accepts a type: NumberRange, which defines a minimum and maximum value to display on the chart.
Modify the updateData() function as follows:
Example Title |
Copy Code
|
---|---|
import { NumberRange } from "scichart/Core/NumberRange"; // Replace the updateDataFunc right before the end of initSciChart() function const updateDataFunc = () => { // Append another data-point to the chart. We use dataSeries.count() // to determine the current length before appending const i = lineData.count(); lineData.append(i, Math.sin(i * 0.1)); scatterData.append(i, Math.cos(i * 0.1)); // ZoomExtents after appending data. // Also see XAxis.AutoRange, and XAxis.VisibleRange for more options xAxis.visibleRange = new NumberRange(i-1000, i); // Repeat at 60Hz setTimeout(updateDataFunc, 1/60); // Warning, this will repeat forever, it's not best practice! }; updateDataFunc(); |
This results in the following.
The above example is simple, but it never removes points from the XyDataSeries, so memory will grow forever. Consider if you are streaming lots of data-points calling XyDataSeries.removeAt, or removeRange to discard old data.
Also, once you are done with a DataSeries, call DataSeries.delete() to remove WebAssembly memory.