// Are you looking for the Fastest/Best WPF Charts?
We recently published an article titled Why SciChart: the Best WPF Charts, with 8 reasons why to choose SciChart for your projects. Top of the list is performance!
“With DirectX hardware acceleration, smart and lossless data-point resampling and an optimized render pipeline, SciChart provides extremely fast WPF charts capable of drawing billions of data-points …” [read more]
Read on to see what our customers say and reasons to choose SciChart for your WPF Chart project
// Introduction
Test results demonstrate that SciChart’s Direct3D11RenderSurface, available in the SciChart Enterprise and SDK Editions, is up to 30x faster than software rendering, and median speed increase is 4x faster than software. In a variety of test results and chart types SciChart’s DirectX Renderer plugin excelled in performance vs. software!
// Measuring WPF Chart Performance
WPF Chart Performance is really important to us at SciChart. We strive to have the best, and the fastest WPF Chart components in the world, but how do we demonstrate what we’ve achieved vs. our competitors to would-be customers?
We’ve created an application which measures our WPF Chart Performance in a number of scenarios, such as line, scatter, scrolling-line and many-series scenarios. The tests are designed to really stress the chart control and find it’s limits.
There there are several factors which influence overall performance of a WPF Chart Control. Such as:
- Number of Series in the chart
- Types of Series (e.g. Line, Scatter, Area, Candlestick)
- Number of data-points per series
- Rate of change of data (number of points appended or removed per second)
- Thickness of pens / number of pixels filled
- Size of the chart viewport on screen
- Number of transformations between data & pixel coordinates per second
- Any additional calculations like Logarithmic Axis scaling or Auto Ranging
These are reflected in the test cases and show stress on different areas of the renderer.
// The Test Setup
Test Setup Configuration
As you may know, SciChart ships with several RenderSurface plugins including the HighSpeedRenderSurface, HighQualityRenderSurface, and now, the Direct3D11RenderSurface, a DirectX10/11 harware-accelerated RenderSurface implementation.
We’ve tested the latest release of SciChart: v5.1, and compared the three renderer plugins across a number of different scenarios in order to highlight the difference in performance of the SciChart RenderSurface implementations.
What Tests are Run
A number of tests are run in our WPF Chart Performance Comparison app which stress different areas of the renderer. These tests are designed to really stress the chart, by having huge numbers of series, or points, or many updates per second.
A certain test is run, and FPS, or refresh rate, is measured via the SciChartSurface.Rendered event, which fires once after each drawing pass completes.
The test cases are as follows:
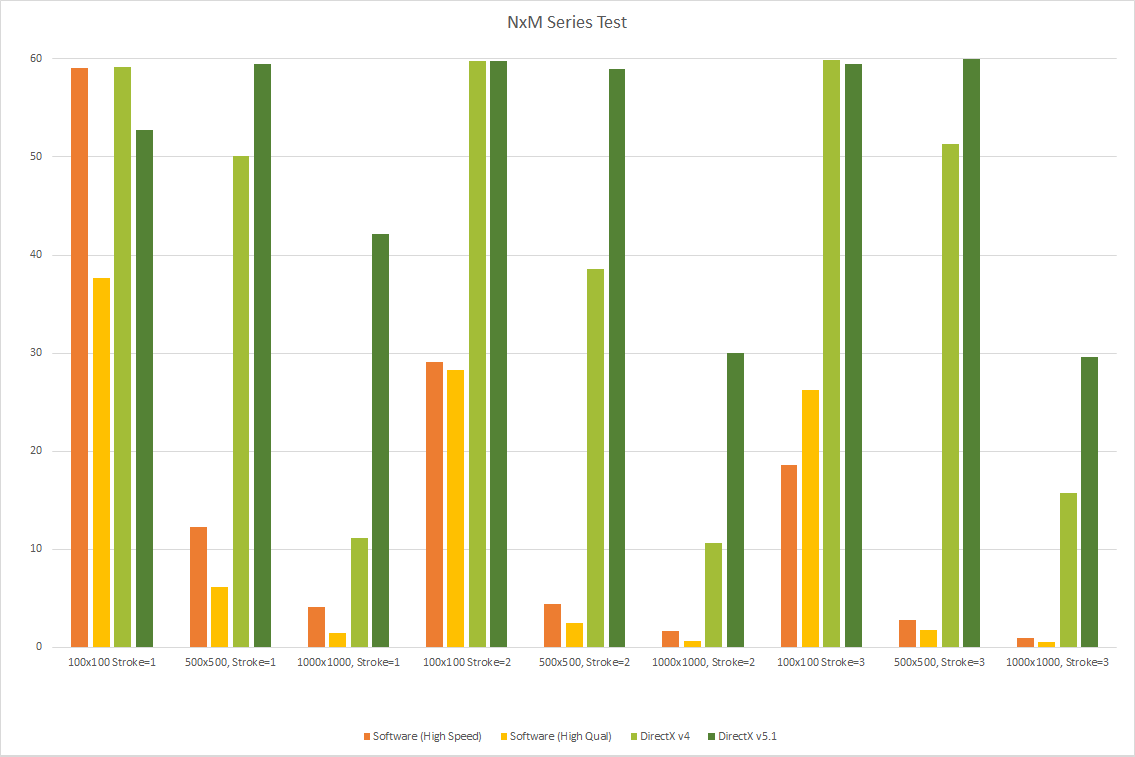
Test 1: NxM Series Test
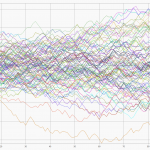
N series of M points are appended to an XyDataSeries, then the chart redraws (the same data) as fast as possible for 20 seconds per test. FPS is measured using the time elapsed between subsequent SciChartSurface.Rendered events.
Areas Stressed: Iterating Data Series, Coordinate Transformation and Drawing.
NOTE: Resampling is not applicable for short data-series (below a few thousand points) so this tests iterating over many data-series, coordinate transformation as well as raw drawing speed.
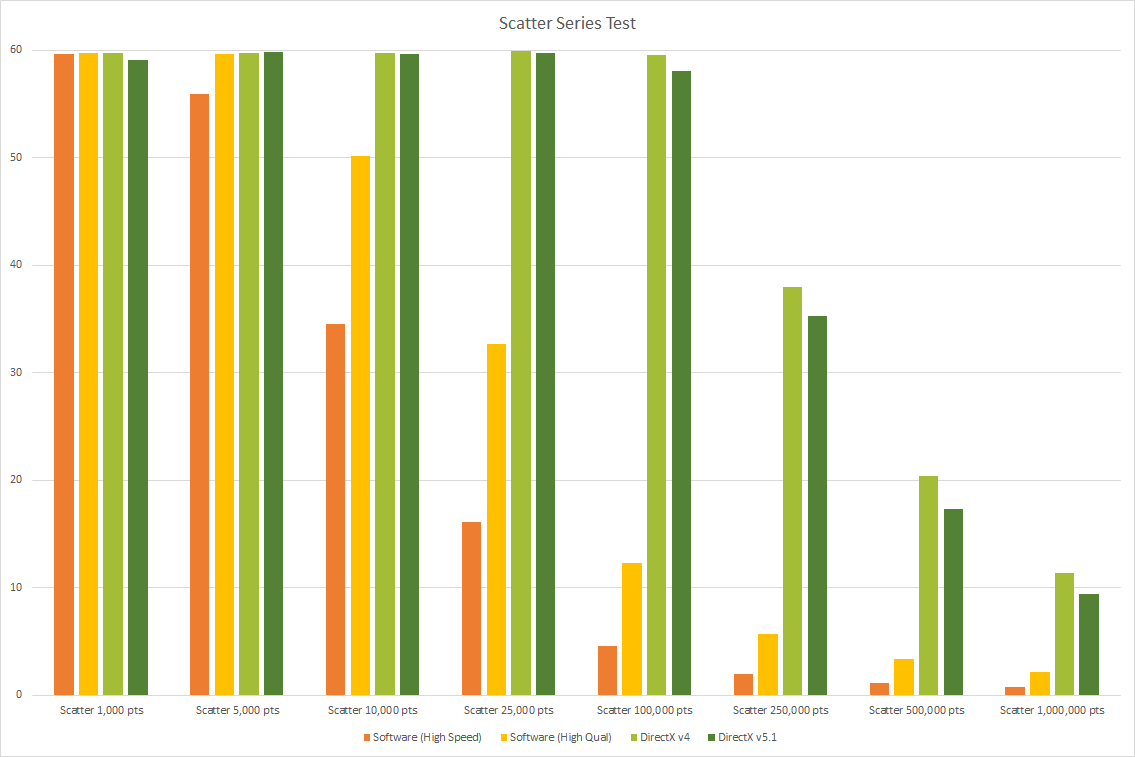
Test 2: Scatter Series Test
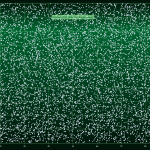
N Scatter points are appended to a XyDataSeries, then the chart redraws. Immediately after, the points are updated in a Brownian motion fashion and the chart is drawn again. The FPS is measured using the time elapsed between subsequent SciChartSurface.Rendered events.
Areas Stressed: Coordinate Transformation, Geometry Generation (Ellipse) and Drawing.
NOTE: Resampling is not applicable for Scatter Series as our standard resampling algorithms do not work with scatter data, so this test effectively tests the geometry generation and drawing speed.
Test 3: FIFO Series Test
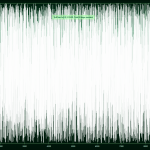
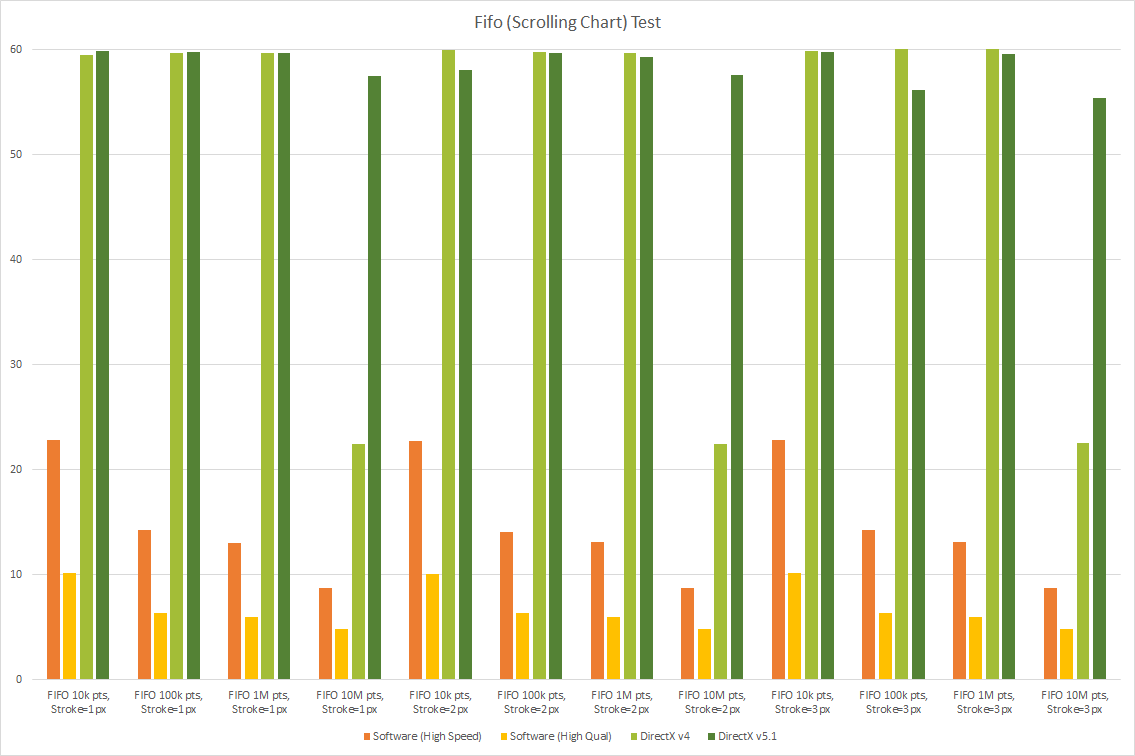
N points are appended to a FIFO (circular buffer) series, then a single point is appended (and one dropped), which triggers a redraw of the chart. The FPS is measured using the time elapsed between subsequent SciChartSurface.Rendered events.
Areas Stressed: Copying Circular Buffers (FIFO Series), Resampling and Drawing.
NOTE: Because the data is random (0-1) lots of pixels are drawn. A heavier emphasis on drawing occurs in this test than resampling, although at higher point counts resampling starts to kick in
Test 4: Append Data Test
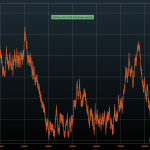
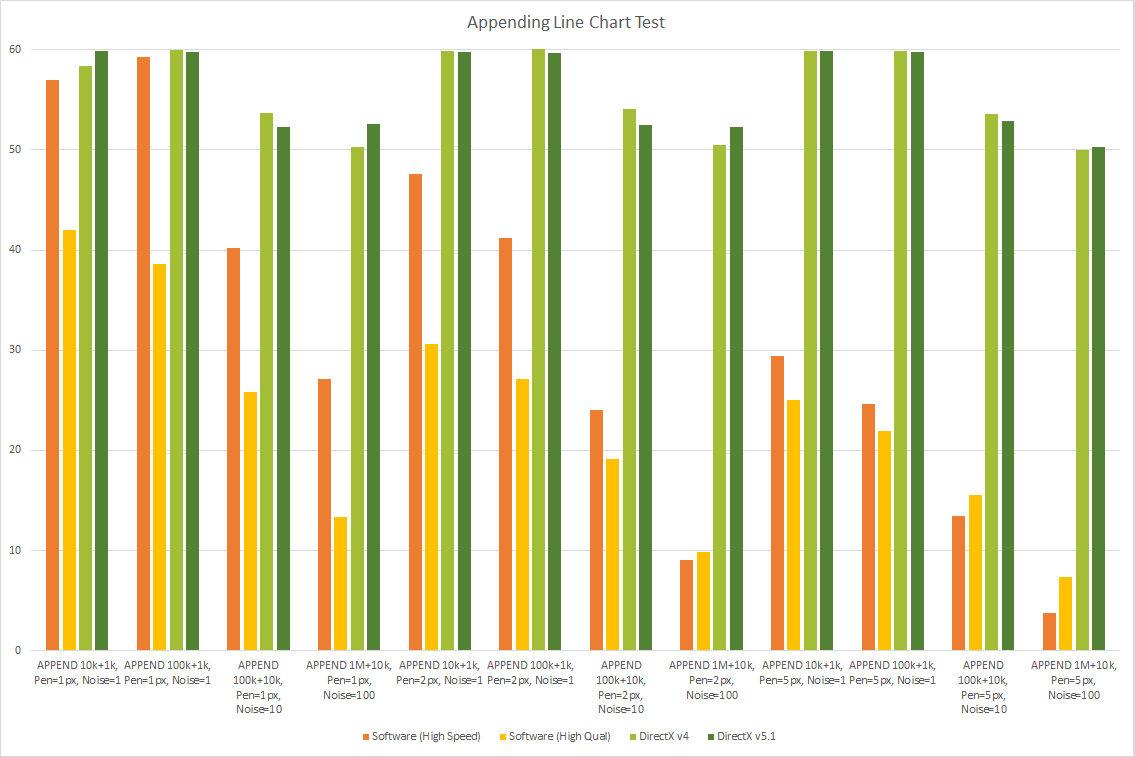
N/3 points are appended to 3 DataSeries, then M points are appended between each draw of the chart. The data is random-walk but we vary noise to create more, or less noisy waves. This has the effect of stressing drawing more (when more noisy) vs. resampling more (when less noisy).
Areas stressed: Appending Data, Resampling, Auto-Ranging and Drawing.
NOTE: As the noise factor is increased, more pixels must be drawn, which stresses the rendering (drawing) more. For lower noise, resampling is the dominant influence on performance.
Test Setup Hardware
- For the Test Setup we have used a desktop workstation with
- Intel i7-5820K 3.3GHz
- 32GB DDR3-2400 RAM
- 2GB NVidia GTX760 video card
- Windows 8.1 Professional
- Tests were run on a 16:10 1900×1200 monitor with the Test Suite application maximised.
For SciChart’s WPF Chart, the CPU and RAM speed are the biggest influencers on overall performance. For the DirectX Renderer the GPU becomes more significant. Please note, that we get decent numbers on a dual-core laptop. You don’t need a powerful machine to get good results, but it helps (especially for DirectX).
// Test Results
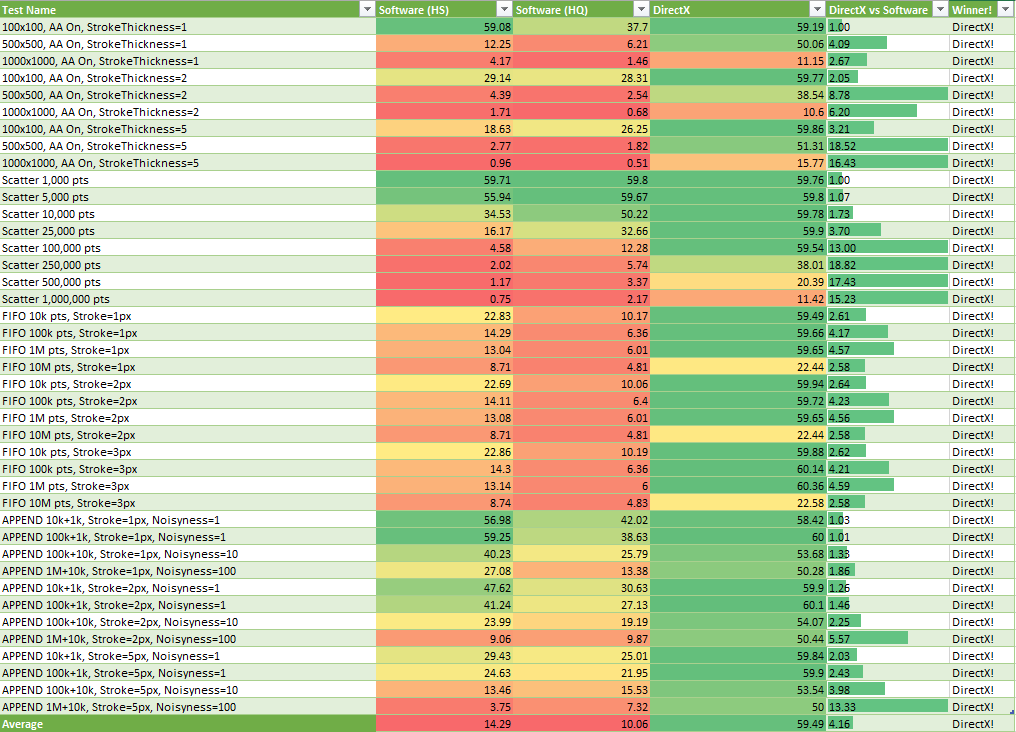
We’ve included the test results below:
- All test result numbers are in FPS (Frames per second), meaning, the average number of redraws per second during the test, as measured by the SciChartSurface.Rendered event.
- We’ve compared the refresh rate of the three renderer plugins: the HighSpeedRenderSurface, the HighQualityRenderSurface and the Direct3D11RenderSurface,.
- The final column (D3D vs HS) is the speed increase of Direct3D11RenderSurface, vs. the HighSpeedRenderSurface, e.g. 2.5 means DirectX was 2.5x faster than software.
- Higher Numbers are better!
In Table Form
// Update: SciChart WPF v5.1 Further Improvements
In SciChart WPF v5.1 we have released a number of performance enhancements including the ExtremeResamplers – a set of C++ resampling algorithms and the ExtremeDrawingManager – an improved, streamlined set of classes for coordinate transformation.
These improve drawing in some of the most demanding of cases. We have written an article about what has changed and how to enable the enhancements in the latest version of SciChart.
Test results for SciChart WPF v5.1 with all optimisations enabled are included below. For the most demanding test cases (1000 series x 1000 points, and FIFO 10M points) we see 4x performance improvements over previous iterations of SciChart WPF.
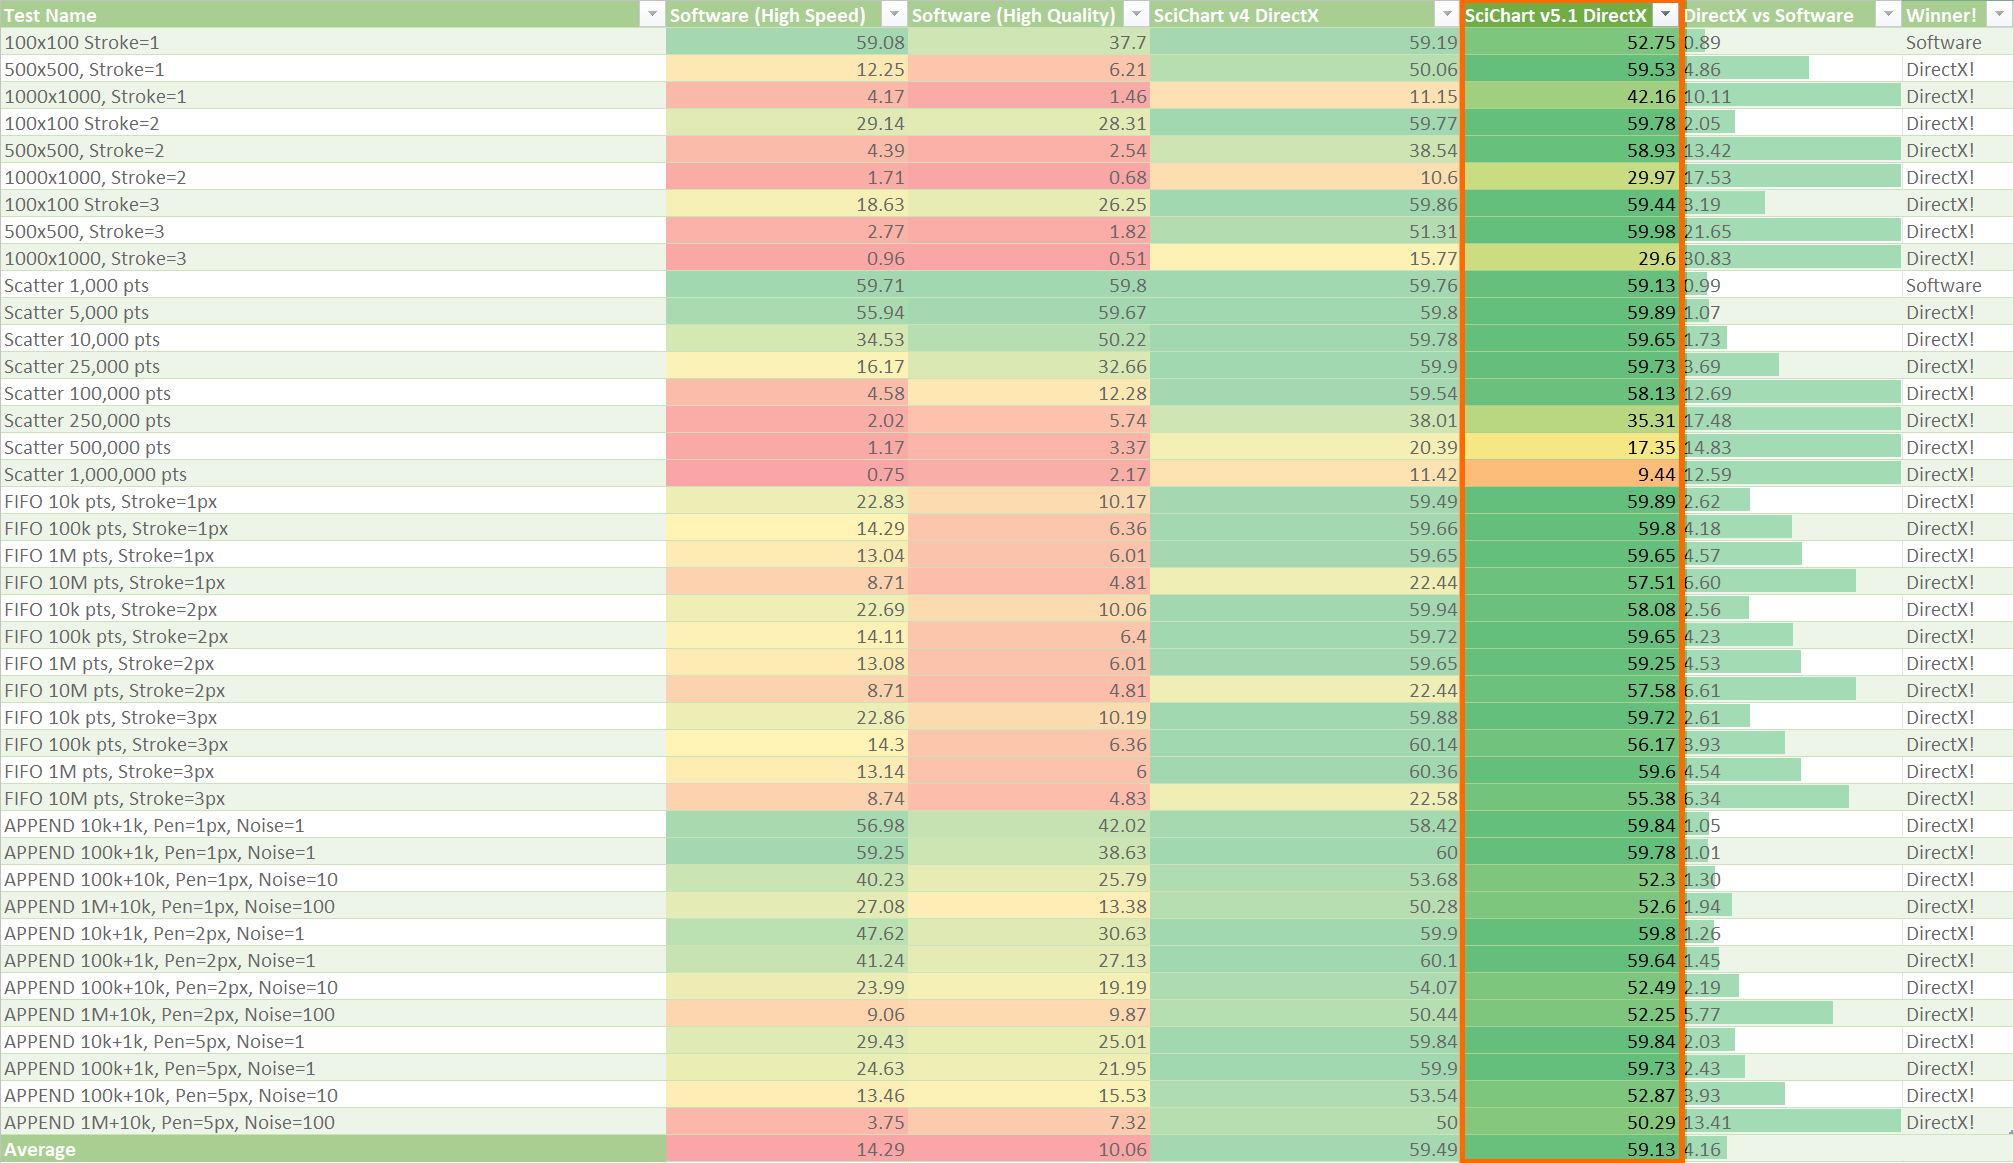
In Chart Form
No WPF Charting Performance Test could be complete without some results in charting form! So, we’ve included the above results as a set of bar charts :)
All results show FPS (Frames per second). Higher numbers are better!
// Analysis of Test Results
Conclusion 1: DirectX is up to 30x Faster than Software (HS)
In over 10 test cases, Direct3D11RenderSurface performance was between 10x and 30x faster than the HighSpeedRenderSurface. That’s better than an order of magnitude speed improvement.
DirectX performance excelled where there were high numbers of points, e.g. Scatter charts with 10,000 – 1,000,000 points, in the 500 series x 500 points tests and when scrolling or appending millions of points on a line chart.
At lower point counts the HighSpeedRenderSurface matched performance of the Direct3D11RenderSurface and is very capable for many WPF charting applications.
Conclusion 2: Median DirectX Performance is 4.14x Faster than Software
The Median speed for the HighSpeedRenderSurface was 14.29 FPS, whereas Median speed for the Direct3D11RenderSurface was 59.13 FPS. This places the DirectX renderer plugin at approximately 4x faster than the software renderer.
The tests where DirectX particularly excelled vs. software where those where many pixels were drawn to the screen, e.g. line appending with high levels of noisyness, or many scatter-points, or large stroke-thickness of lines.
Conclusion 3: DirectX Quality Exceeds that of the HS Software Renderer
The Direct3D11RenderSurface Quality matches that of the HighQualityRenderSurface, and exceeds that of the HighSpeedRenderSurface. In comparison to High Quality, the median performance of DirectX was almost 6x faster, yet providing similar floating-point antialiased line quality to this render surface.
Conclusion 4: With DirectX enabled, only 4 tests were below 30FPS
The limit for an animation to appear smooth is about 30FPS (frames per second).
36/40 test results were smooth (above 30FPS) for DirectX, compared to 7/40 for the software renderers.
The cases where DirectX Frame-rates dropped below 30 FPS tended to be extreme cases, e.g. 1000 series x 1000 points, 1,000,000 point scatter charts.
// Enabling DirectX in your Application
To enable DirectX in your application, please use the following code. The trial version allows the Direct3D11RenderSurface but by default, it is not enabled. It is enabled in our demos and examples. Additional optimisations can be enabled via attached properties. To learn more about the optimisations included in SciChart WPF v5.1 see Performance Improvements in SciChart WPF v5.1.
...
*Please note: the DirectX Renderer is currently included as part of SciChart WPF 2D Enterprise and SciChart SDK Product Tiers only. It is not enabled by default, but is permitted in the trial version.
// Download the Test Suite
Download the WPF Chart Performance Test Suite.
This Application is based on the WPF Chart Performance Comparison application published by Scott Logic in 2012 and has been adapted to test SciChart’s WPF Chart performance in a number of scenarios. We are even able to test SciChart performance vs. competitors. Feel free to adjust the application for your needs!
Related Posts
