// Are you looking for the Fastest JavaScript Charts?
SciChart.js, our Ultra-High Performance JavaScript Chart library is now released!
“With WebAssembly and WebGL hardware acceleration and an optimized render pipeline, SciChart provides extremely fast, realtime JavaScript charts capable of drawing millions of data-points in realtime …” [read more]
About a year ago we announced that we would begin research into SciChart.js – a Fast, Realtime 2D & 3D Chart Component for HTML5 / Javascript apps. Today we have some more results to share with you and an update on our progress!
SciChart.js development is well underway within SciChart. Without giving too many technical details away, we have a cross-platform graphics engine which enables our extremely fast 2D & 3D charts on Windows, Mobile. This has now been cross-compiled to the web entirely and we are working on the top level API.
See below to see a video of our progress to date, and how far we’ve come in a short period of time developing a high performance, real-time javascript chart.
SciChart.js will have the API you are familiar with when using SciChart. Our existing WPF, iOS & Android charts have the following concepts for chart parts:
- SciChartSurface: the top level chart container
- RenderableSeries: responsible for drawing Line, Mountain, Column, Scatter, Candlestick chart series
- DataSeries: a data-structure which holds your data. Supports dynamic update (Append, Insert, Update, Remove) for real-time charts.
- ChartModifiers: behaviours which are tagged onto the chart – zooming, panning, tooltips etc…
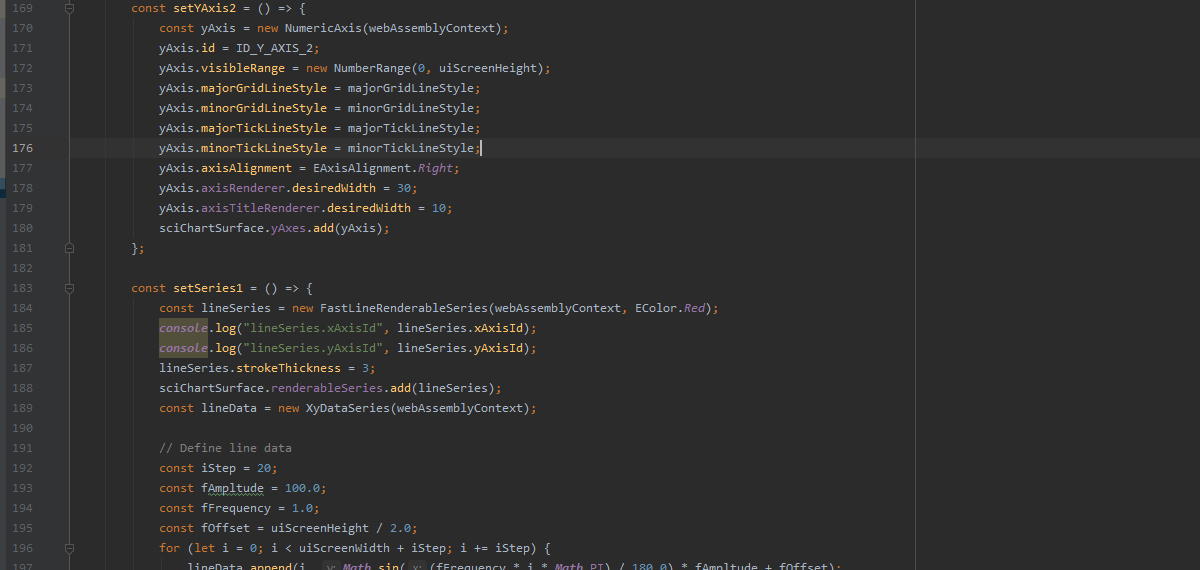
For example, declaring a chart like will be possible in TypeScript or Javascript using code like this:
// Create the SciChartSurface targeting DOM id canvas-id
const sciChartSurface = new SciChartSurface('canvas-id');

// Create DataSeries, using Append, Insert, Update, Delete that you are familiar with
const data = new XyDataSeries();
data.append([0,1,2,3,4], [10,11,12,13,14]);

// Add RenderableSeries for lines, candlestick charts, scatter charts etc...
sciChartSurface.renderableSeries.add(new FastLineRenderableSeries({ dataSeries: data } ));

// Add and configure X & Y axis
sciChartSurface.xAxes.add(new NumericAxis());
sciChartSurface.yAxes.add(new NumericAxis());

// Add zooming, panning or tooltip behaviour
sciChartSurface.chartModifiers.add(new ZoomPanModifier());
sciChartSurface.chartModifiers.add(new TooltipModifier());
…which would result in a chart with single X,Y axis, a line series with 5 data-points and the Zoom pan and Tooltip behaviours added to the chart.
We’re also aiming to make SciChart available to vanilla JS applications as well as popular frameworks such as React, Vue.js etc…
Why SciChart.js?
Why build SciChart.js? Javascript, Typescript and React chart libraries are ten a penny right?
Well, there’s a few reasons why we wanted to build SciChart for javascript applications, and why SciChart will be a great choice for your future web projects.
Realtime Performance
We’ve always provided the best-in-class for performance, and SciChart.js will be no different. Built on our blazing fast 2D/3D engine Visual Xccelerator, SciChart.js will be able to render millions of data-points in realtime in Javascript applications.
Excellent, Best-in-class API
Our API is rated the best for charts on Windows and Mobile platforms, because it is easy to use, powerful, flexible and provides deep customisation. SciChart.js will be no exception and we are porting our award-winning API to Typescript/Javascript so you can have the same excellent best experience on the web.
2D and 3D Charts
SciChart provides not only 2D Charts, but also hardware-accelerated 3D Charts. Need a WebGL powered 3D Chart component for scientific or data-intensive applications? SciChart.js will be able to do that.
Suitable for Demanding Applications
SciChart is geared towards demanding applications such as Financial & trading, Scientific & Medical, Engineering as well as complex enteprise applications which need the best possible visualisation.
Our software is used around the world by companies ranging from Automotive to F1, Banking & Trading, Oil & Gas to Cancer Research, Medical applications to fitness tracker apps. Across sectors SciChart makes impossible projects possible, and we believe web will be no different…
Sign up to our Newsletter!
Are you interested in real-time high performance 2D & 3D Charts for Javascript applications? To be notified about updates of SciChart.js as we develop for this exciting new platform, sign up below:
What is SciChart?
SciChart is a High Performance, Realtime Chart component. Capable of drawing many millions of data-points, SciChart is the Best Chart component for WPF (Windows), providing extremely fast, and flexible charts for Big-Data, Scientific, Medical and Financial applications that demand the best performance and user experience.
SciChart is also available for mobile devices and now macOS, allowing extremely high performance charts on the iOS and Android Platforms. You can find out more about SciChart by visiting our website.
Related Posts
