SciChart’s Cross-Platform Vision Complete!
SciChart has achieved a great deal in the past year, notably the pace of large releases has really increase in […]
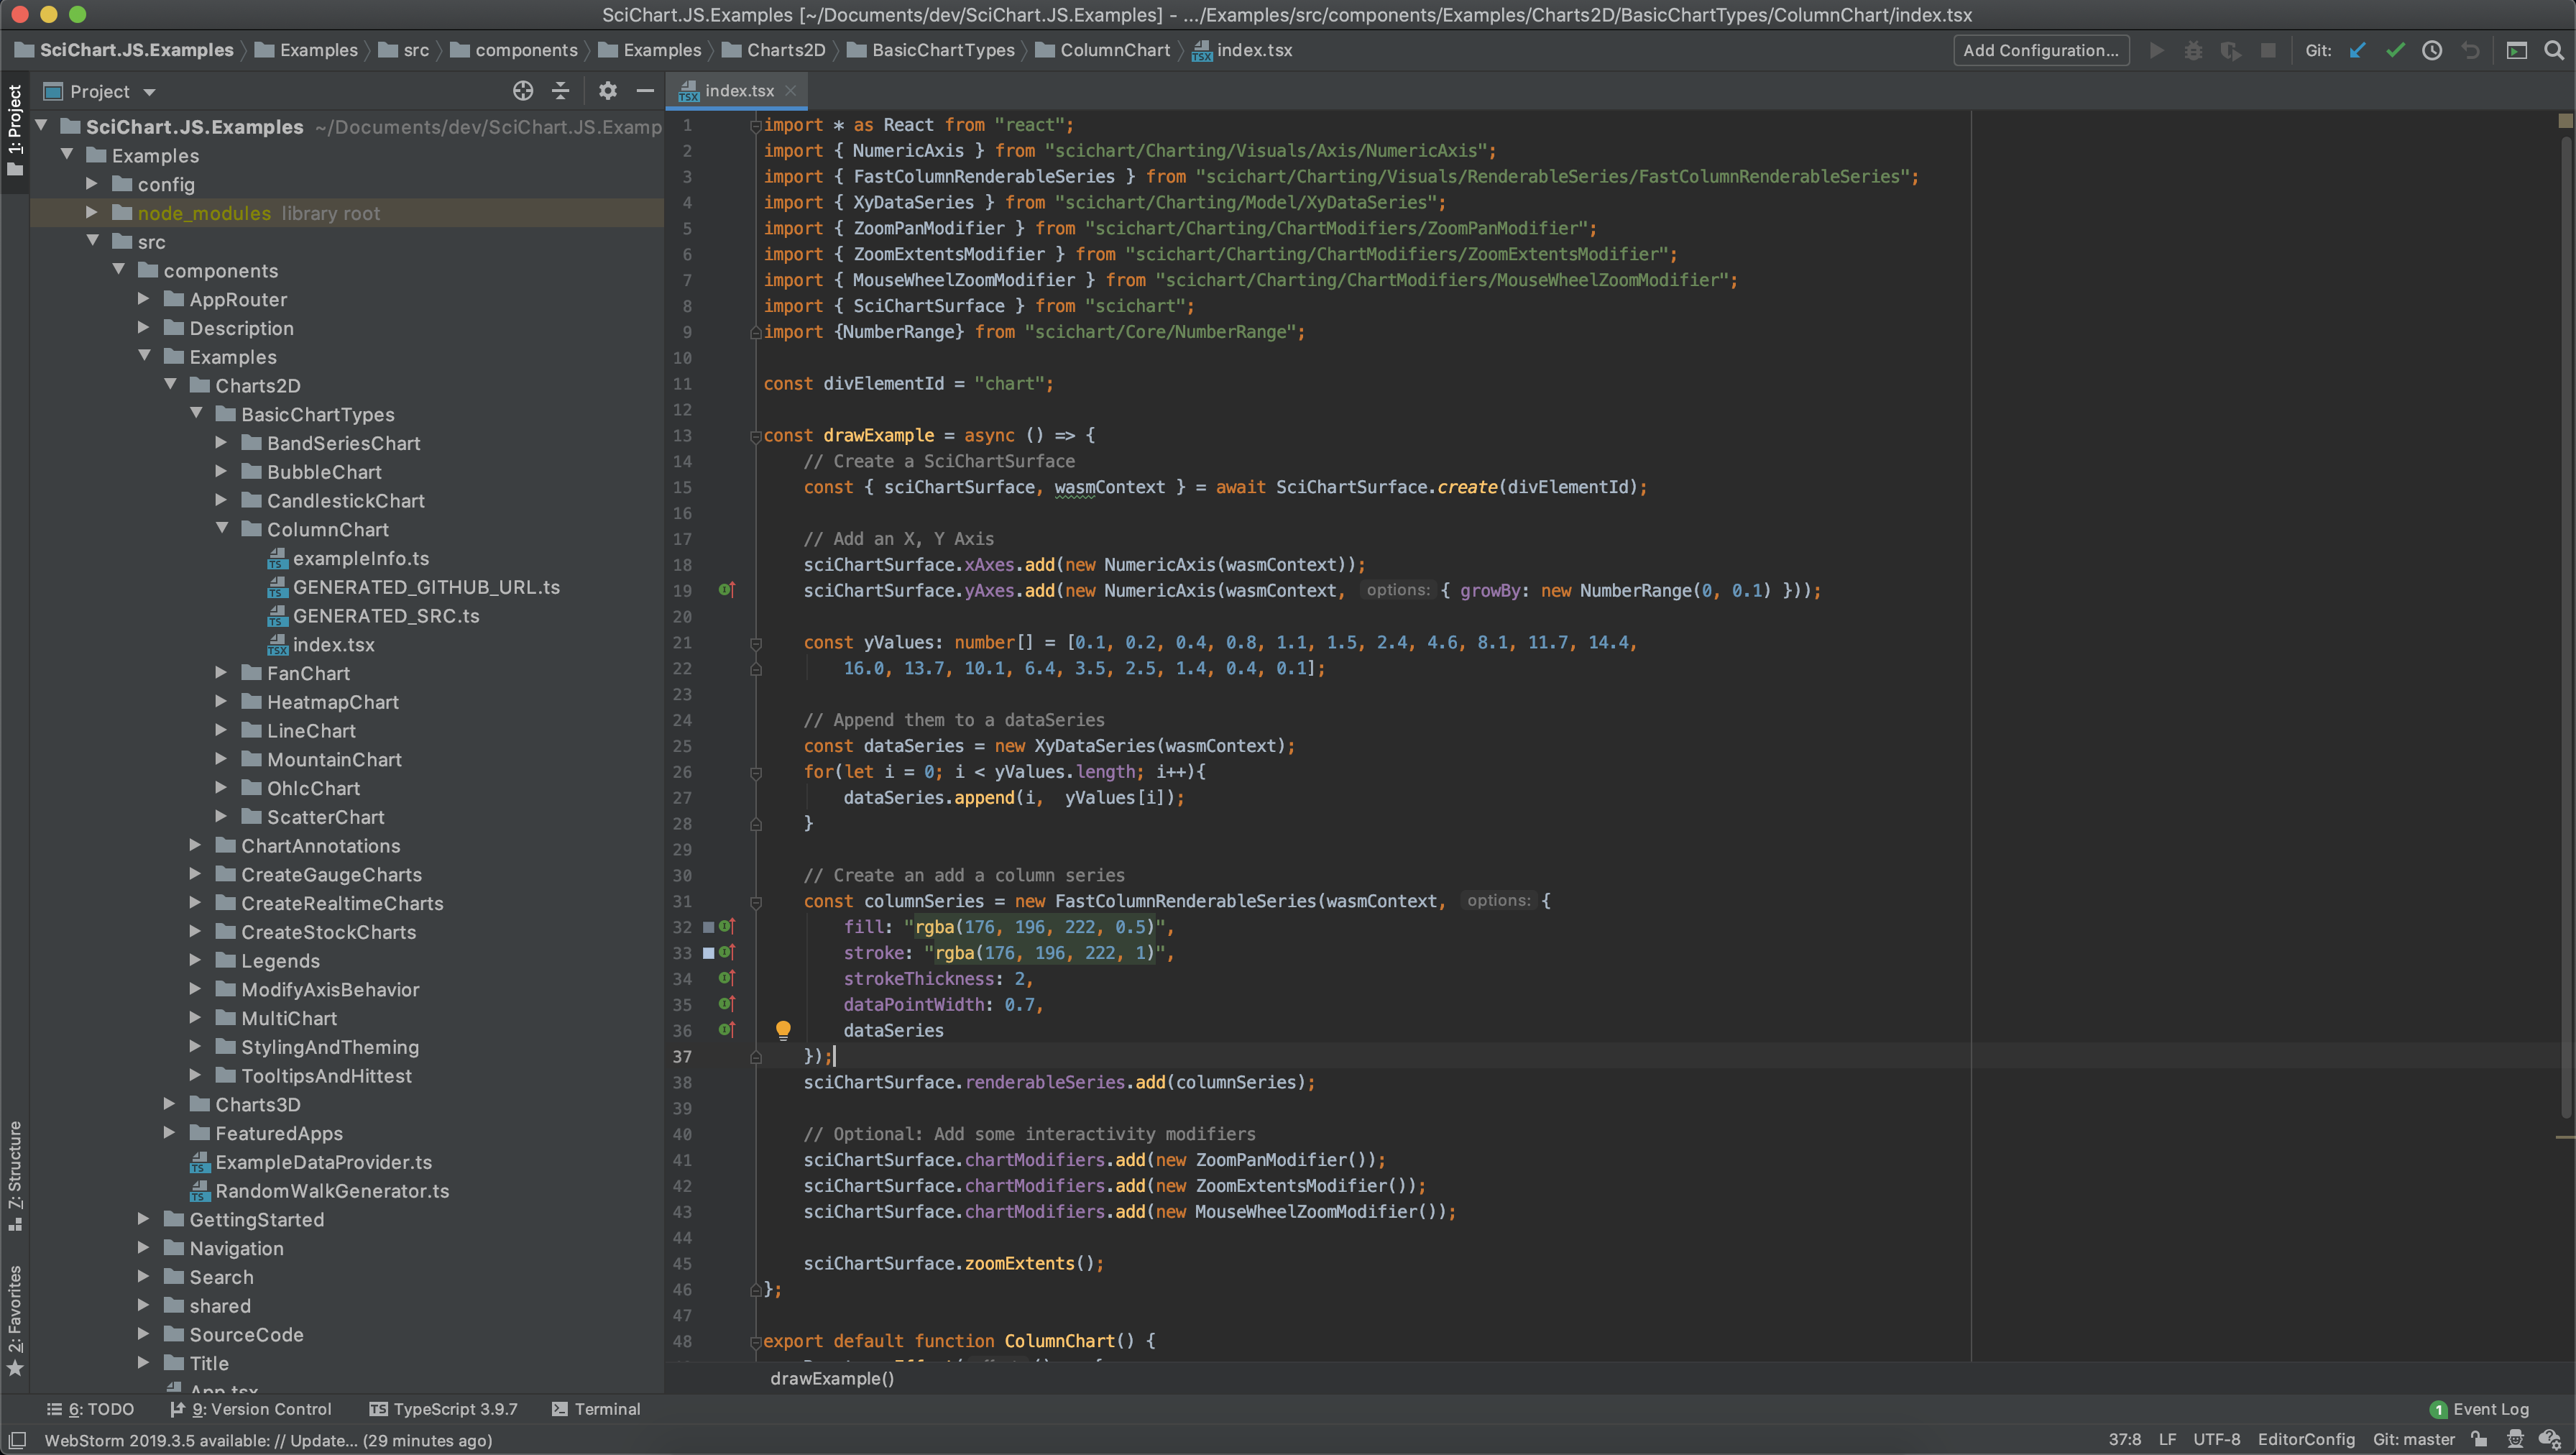
SciChart.js, our Ultra-High Performance JavaScript Chart library is now released!
“With WebAssembly and WebGL hardware acceleration and an optimized render pipeline, SciChart provides extremely fast, realtime JavaScript charts capable of drawing millions of data-points in realtime …” [read more]
Hey SciChart fans! We wanted to give you an update on our progress in creating SciChart.js – Fast JavaScript 2D/3D Charts for Web applications. You can watch a 5-minute flash update in the video below. Do be sure to subscribe to our YouTube page if you want to be notified of further updates!
Barring any unforeseen circumstances, we are about a month away from a BETA. The BETA version will be shipping with an examples suite, documentation and tutorials on day 1, and will include the following features:
We will also be producing a set of documentation going over the main API features, a set of tutorials which will be in code / web and video format.
Are you interested in real-time high performance 2D & 3D Charts or creating the next generation of Javascript Charting applications? To be notified about updates of SciChart.js as we develop for this exciting new platform, sign up below:
Subscribe for SciChart.js Updates
SciChart is a High Performance, Realtime Chart component. Capable of drawing many millions of data-points, SciChart is the Best Chart component for WPF (Windows), providing extremely fast, and flexible charts for Big-Data, Scientific, Medical and Financial applications that demand the best performance and user experience.
SciChart is also available for mobile devices and now macOS, allowing extremely high performance charts on the iOS and Android Platforms. You can find out more about SciChart by visiting our website.
Related Posts
![]()
Queens Award for Innovation
Proud winners of the Queens Award for Innovation, 2019. Awarded on account of our innovative graphics engine which underpins the SciChart library and enables our world-beating charting performance
![]()
National Business Awards
Highly Commended for Lloyds National Business Awards, 2019. Awarded on account of our innovative graphics engine and impressive customer base
![]()
National Technology Awards
Awarded “Healthcare Tech of the Year” at the 2025 National Technology Awards – a top UK recognition for breakthrough innovation in technology.

Reviews
SciChart has received hundreds of verified, 3rd party reviews