

SciChart’s Cross-Platform Vision Complete!
SciChart has achieved a great deal in the past year, notably the pace of large releases has really increase in […]
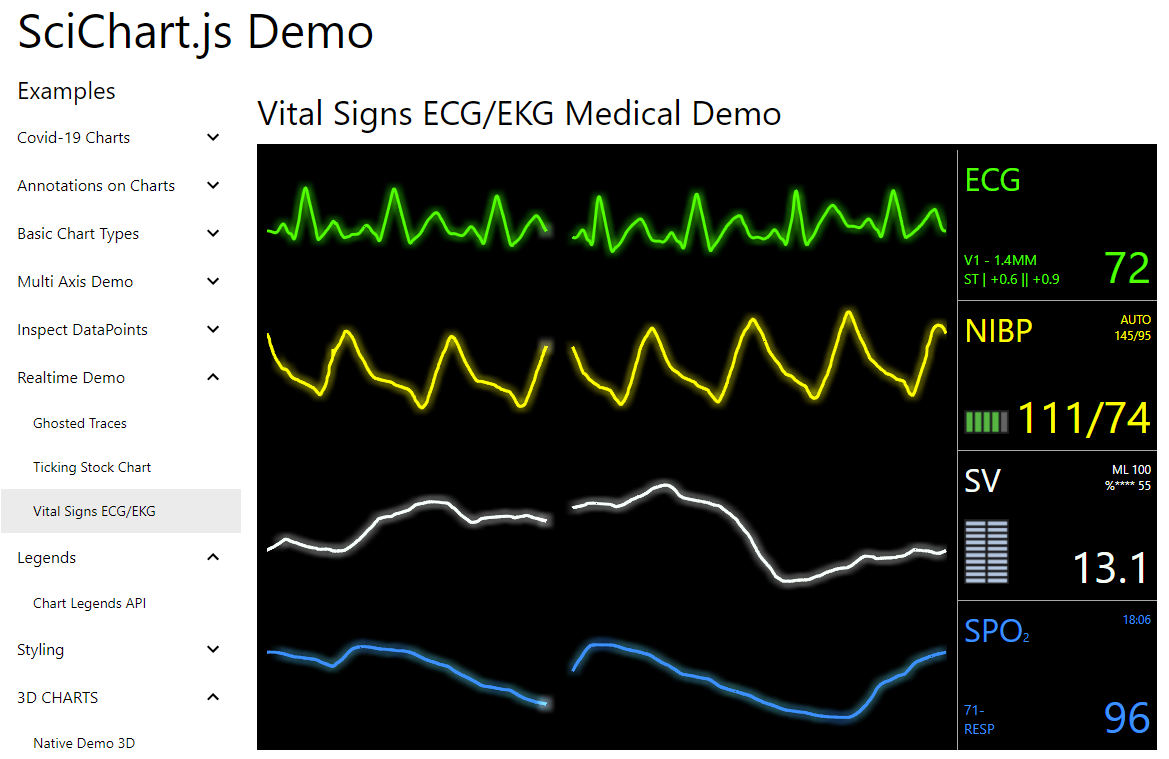
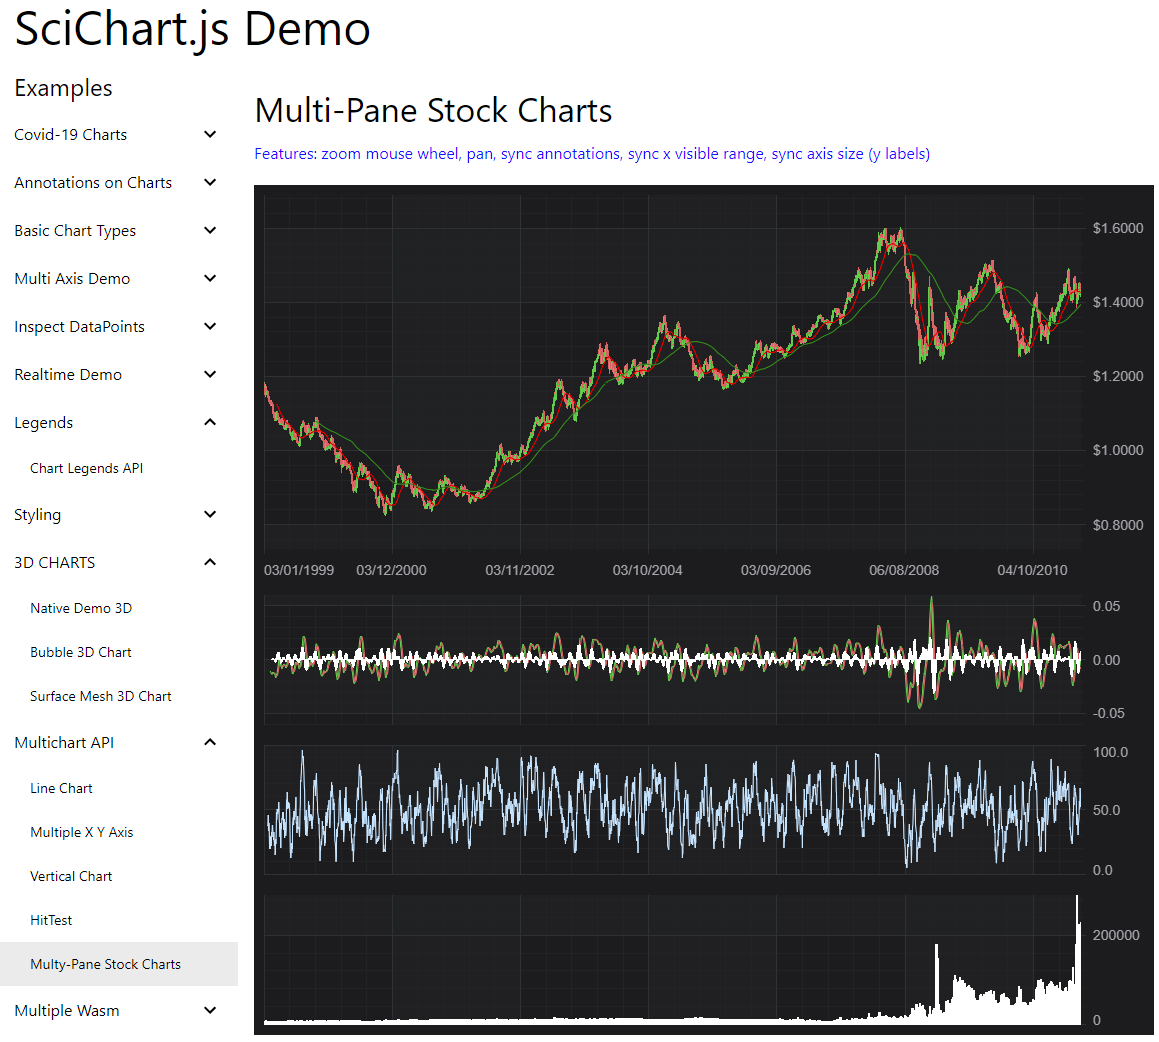
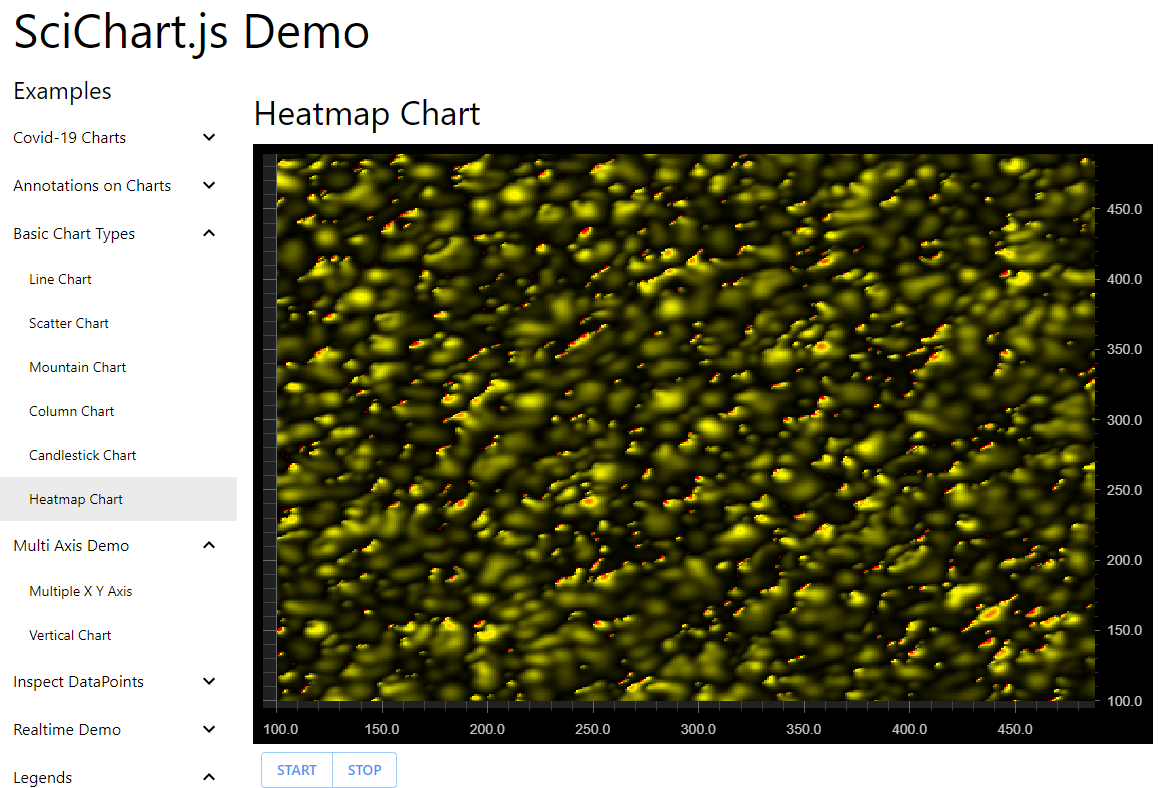
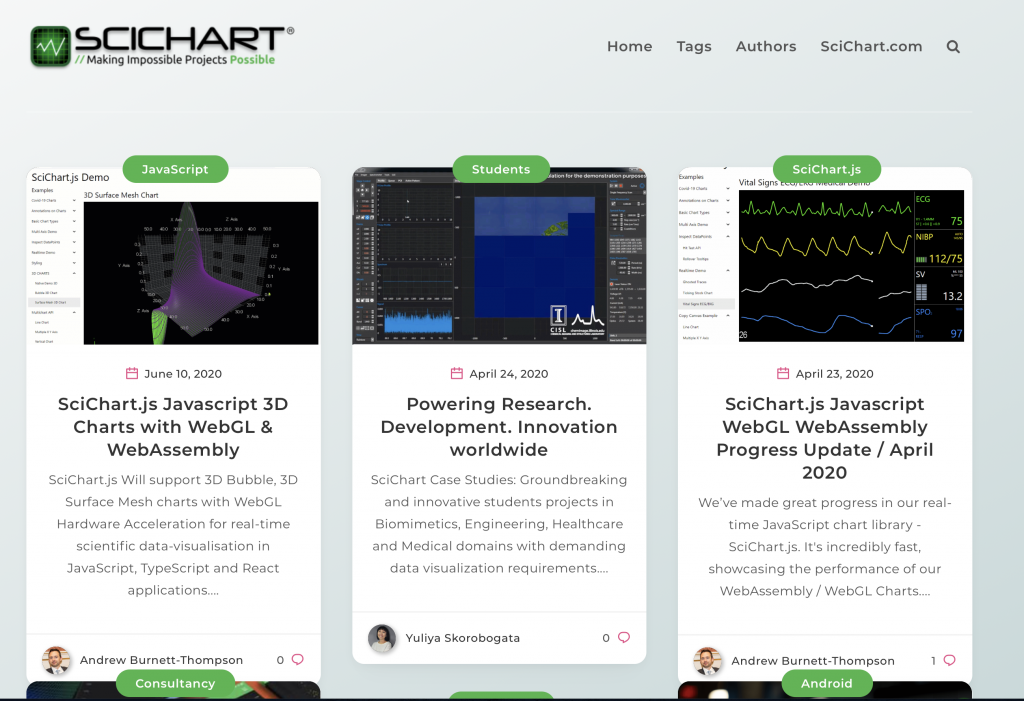
SciChart.js, our Ultra-High Performance JavaScript Chart library is now released!
“With WebAssembly and WebGL hardware acceleration and an optimized render pipeline, SciChart provides extremely fast, realtime JavaScript charts capable of drawing millions of data-points in realtime …” [read more]
Hello everyone!
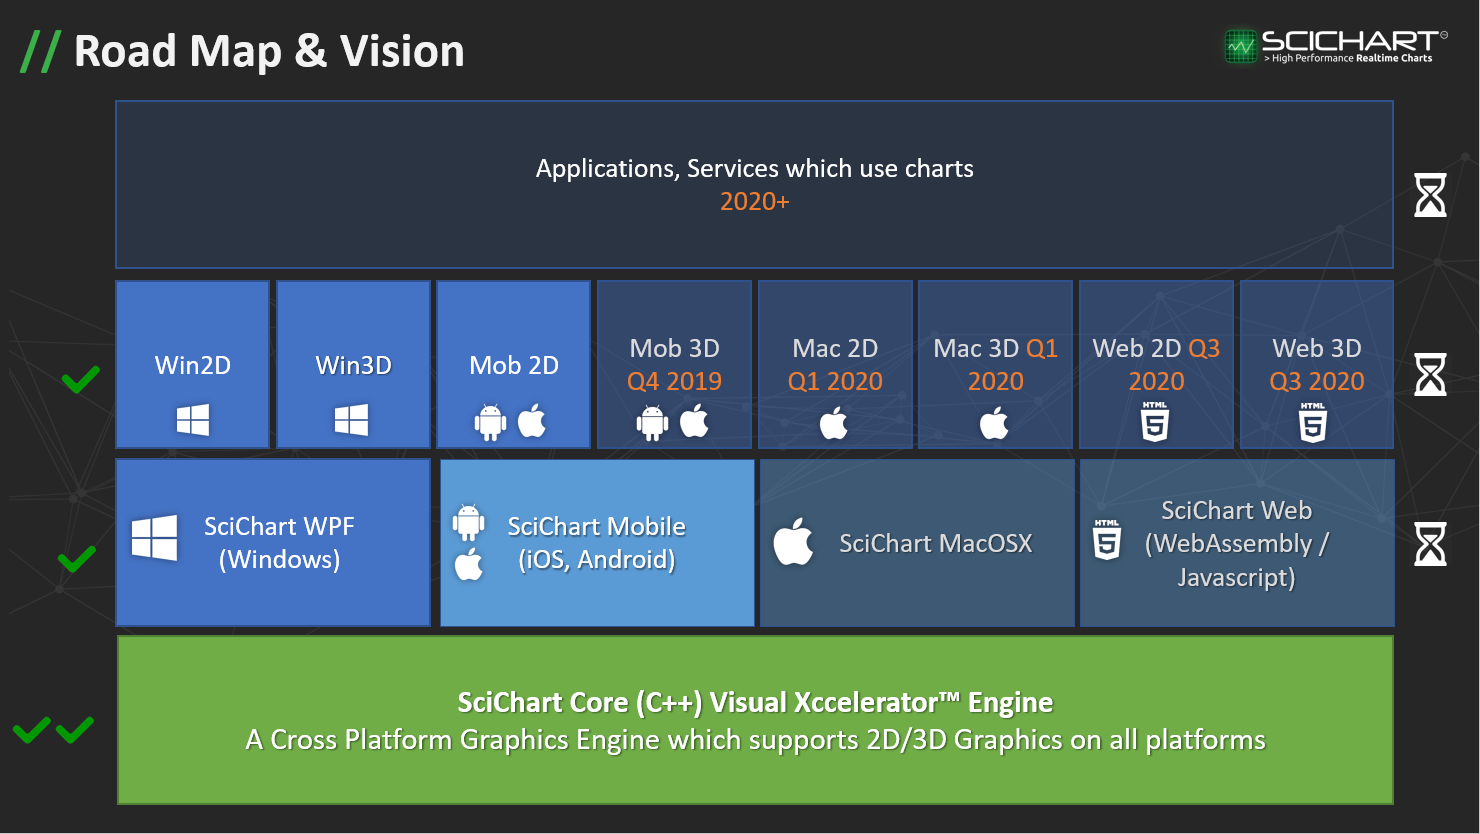
I wanted to give you a roadmap progress update as to what we are building, and give you some possible release dates for exciting enhancements to the SciChart product lineup.
2020 has been so far an absolutely crazy year … I’m sure many people have experienced disruption, crisis and some may even have lost loved ones, and we are no exceptions. However, near the start of the year we made the concerted decision to batten down the hatches and ride out the storms that the world is facing. As a result, we turned our attention to R&D, as these storms will pass, and when they do, we wanted to have new features, products and enhancements ready to go for our customer base.
I’d like to give you a short update on what we are developing now, and some progress at this mid-point through the year.
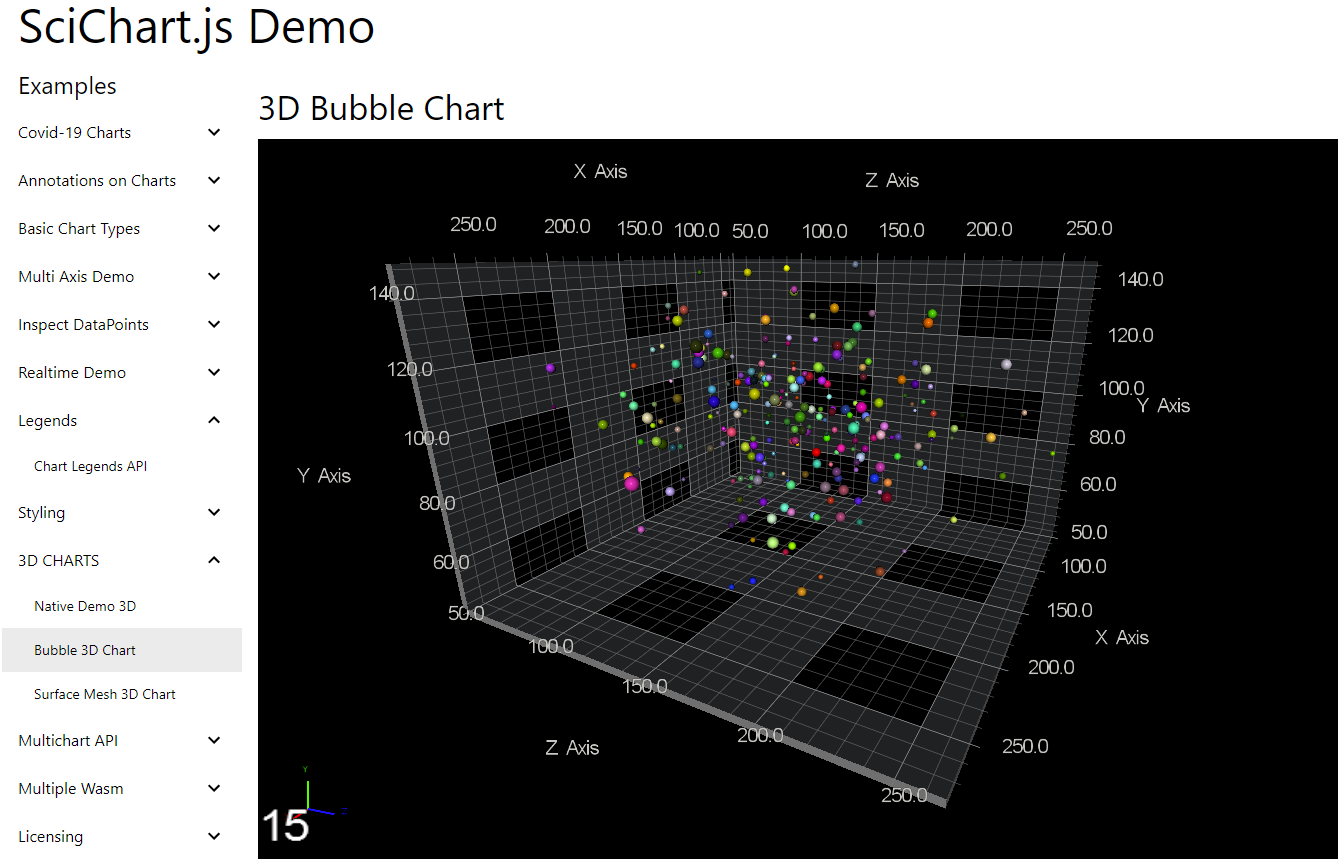
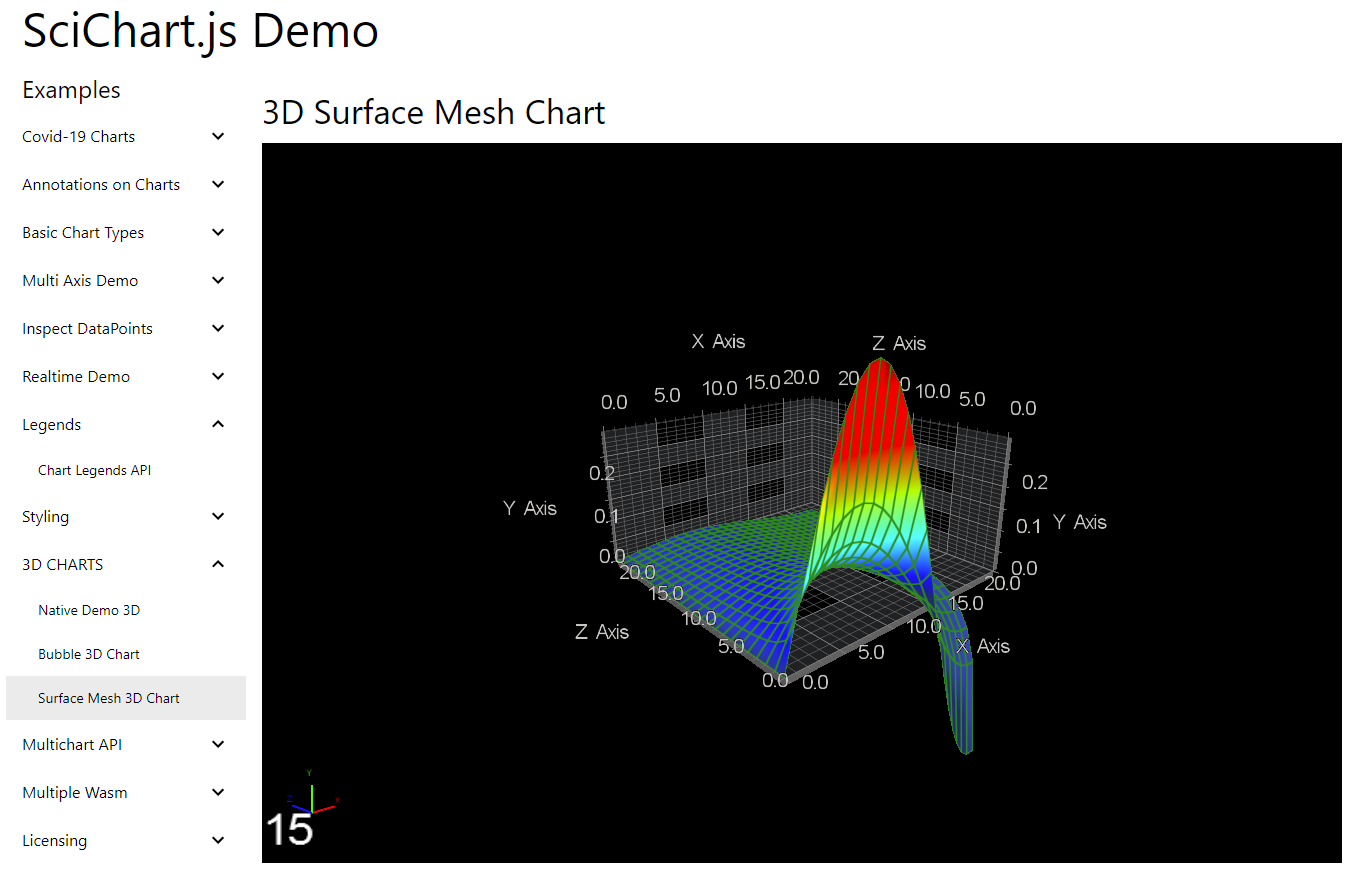
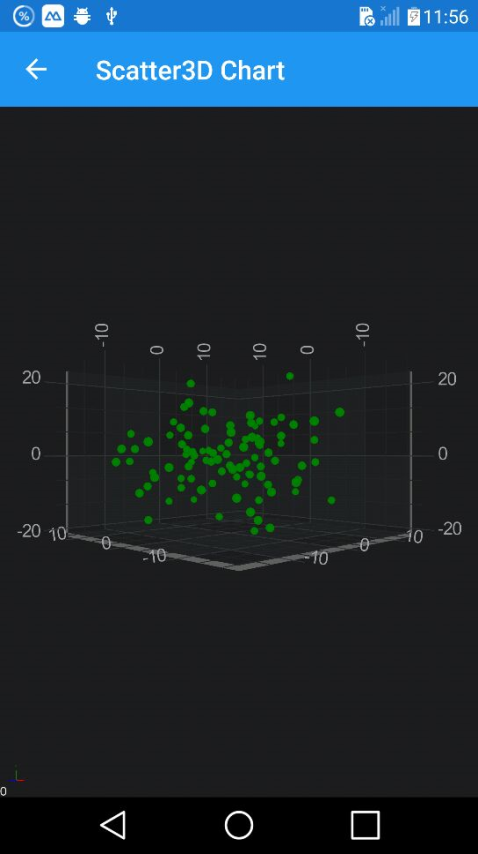
SciChart.js is a Fast Real-time Javascript 2D/3D Chart component. We launched our 3D engine earlier in the year on our Windows platform – known as Visual Xccelerator, it speeded our WPF Charts (Windows) by 10-100x resulting in insane performance such as our 10 Billion Datapoint tech demo. Using cutting-edge technology, we are the first in the world to develop an in-house, lightweight, cross-platform 3D graphics (game) engine and cross-compile it to all platforms including Windows, iOS, Android, MacOSX and now the web – with WebAssembly and WebGL.
WebAssembly represents a step-change for browser applications, as far from using only Javascript, which can be a performance bottleneck for critical sections of code, we are able to re-use our extensive C++ codebase and compile to WebAssembly (wasm) and use this in Javascript applications. SciChart.js will represent the absolute cutting-edge in Javascript 2D/3D charting, as no other chart library vendors in the world are currently developing the kinds of innovations that we are.
You can watch the video below to see our progress so far and how we’re coming along with this exciting new platform.
Our progress to date includes:
You can learn more about our progress and sign-up for newsletters over at the NEW SciChart Blog.
We’re making steady progress here and aiming to have something to release to our user base as soon as possible. Obviously, we have to make sure it’s a quality product and not something half-thought out so until we have something that we don’t think is going to change much we will wait.
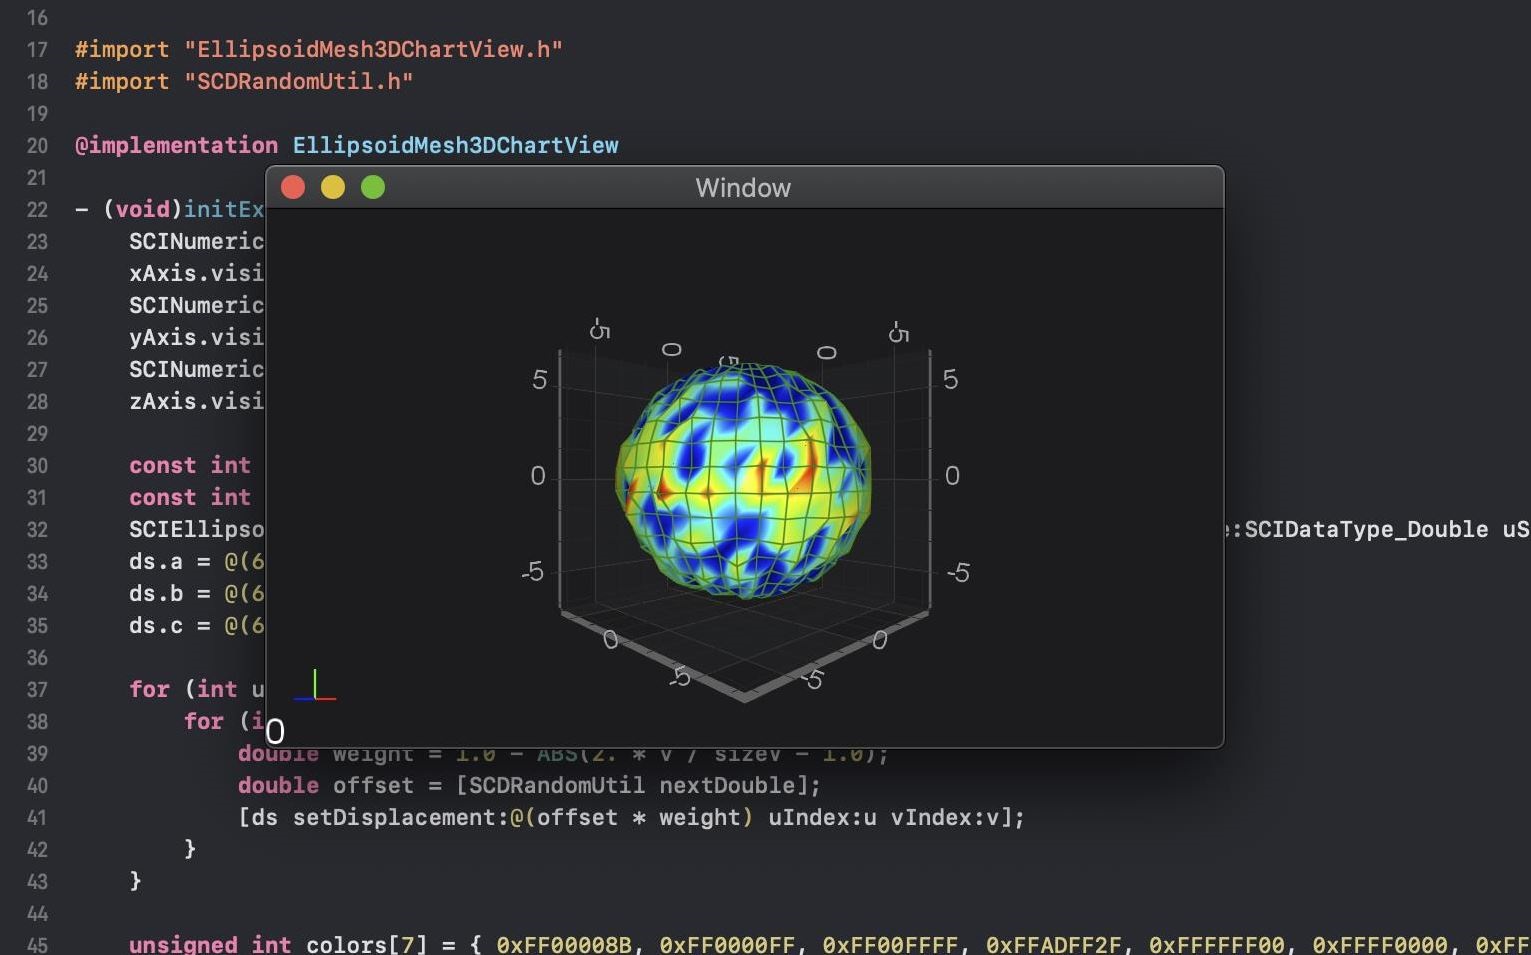
Another platform we’ve been building for is Mac OSX Desktop. Our Fast, Native iOS chart library is written in Objective-C and Swift, and allows you to create big-data, real-time data visualisations on iPhone and iPad devices. However, a feature request we are often asked about is MacOS.
90% of the code is portable immediately, no change, however it’s that last 10% that needs work. The zooming, panning interaction on an iPhone is via touchscreen whereas on a Mac it’s mouse or touchpad gestures. Annotations or labels which are drawn with UIView on iOS are not portable to MacOS. So we’ve been refactoring and working steadily and aim to bring you something soon.
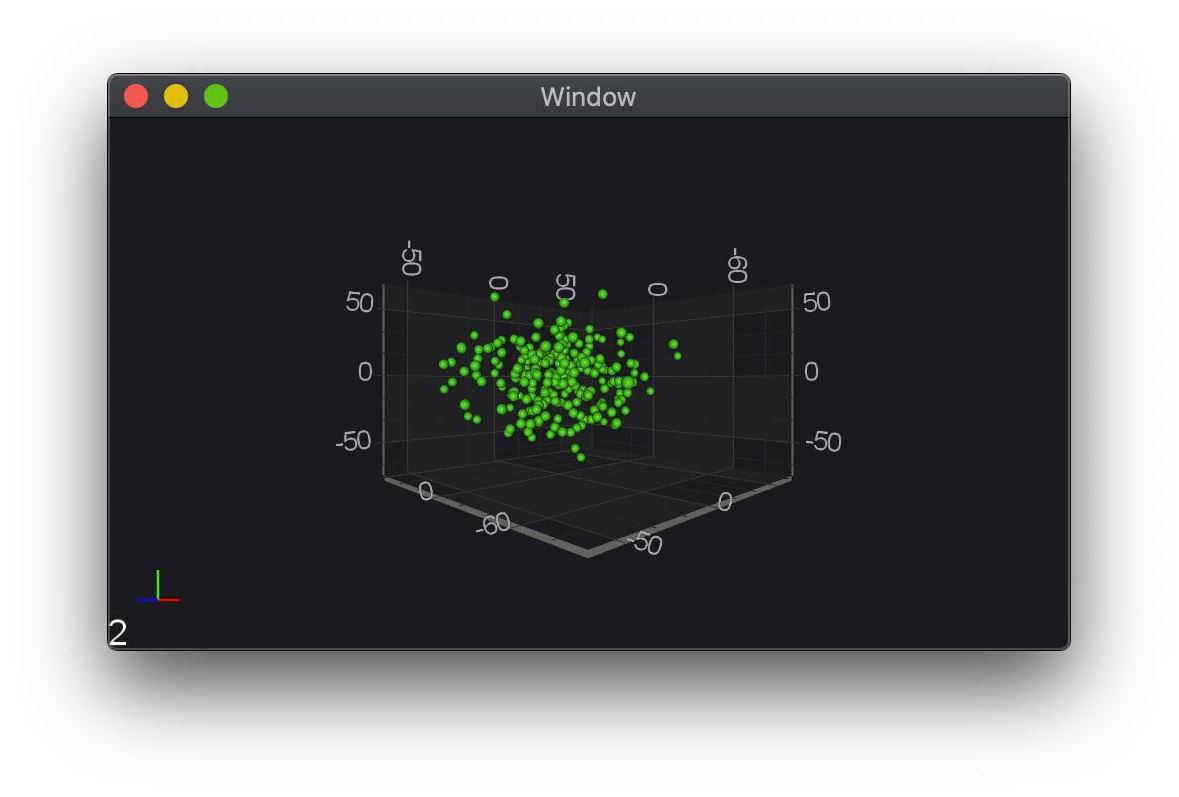
When go-live, the SciChart Mac OSX platform will bring you fast, hardware-accelerated 2D/3D charts on the Mac desktop platform and will be available in the Bundle 2D, Bundle SDK and Bundle SDK Enterprise packages.
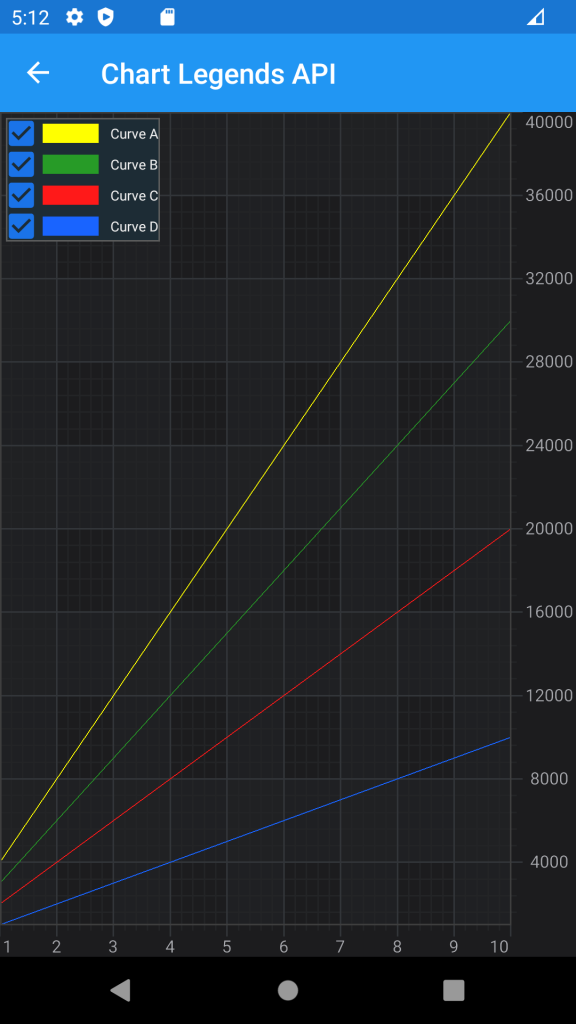
With our iOS/Android charts v3 released at the start of this year, bringing you hardware accelerated 2D & 3D charts to the iOS & Android platforms, we have turned our attentions on how best to expand the reach of SciChart and enable our users to build applications in different kinds of frameworks.
One framework which gets requested a lot is Xamarin Forms. At the moment we support Xamarin.iOS, Xamarin.Android which allows you to create Xamarin applications with SciChart. However a true Xamarin Forms wrapper (allowing write-once run anywhere) is missing from the SciChart product lineup.

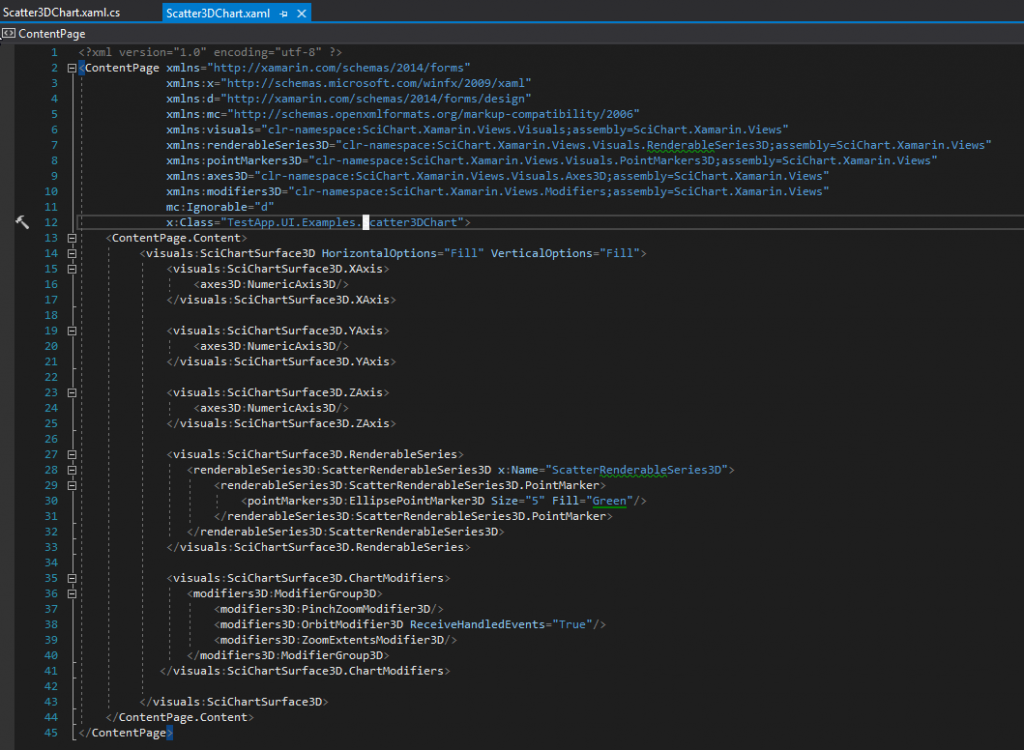
We’ve made some progress in this area by writing a wrapper generator around our Xamarin.iOS/Android chart libraries. This generates the necessary Custom Renderers or Views and XAML API allowing you to include SciChart in Xamarin Forms applications, with familiar XAML based code like this:
We don’t typically like to give you a release date before things are ready, as there is often work to be done polishing code or making something production-ready long after it looks or feels finished.
Right now SciChart for Javascript, Mac OSX and Xamarin Forms are all making great progress, what we’re aiming for is Q3/Q4 release, although previews or some platforms may be sooner than that. If you are interested to receive notifications or updates then you can sign-up to our SciChart.js newsletter below, or just watch our social media pages such as LinkedIn, Twitter and Facebook as all announcements go there.
Finally if you’d like to speak to us to talk about your requirements or get more in-depth information, then contact-us! We’re always happy to hear from our customers & prospects to hear how we can better serve you.
Best regards,
Andrew
[SciChart Team]
Related Posts
![]()
Queens Award for Innovation
Proud winners of the Queens Award for Innovation, 2019. Awarded on account of our innovative graphics engine which underpins the SciChart library and enables our world-beating charting performance
![]()
National Business Awards
Highly Commended for Lloyds National Business Awards, 2019. Awarded on account of our innovative graphics engine and impressive customer base
![]()
National Technology Awards
Awarded “Healthcare Tech of the Year” at the 2025 National Technology Awards – a top UK recognition for breakthrough innovation in technology.

Reviews
SciChart has received hundreds of verified, 3rd party reviews