SciChart’s Cross-Platform Vision Complete!
SciChart has achieved a great deal in the past year, notably the pace of large releases has really increase in […]

SciChart.js, our Ultra-High Performance JavaScript Chart library is now released!
“With WebAssembly and WebGL hardware acceleration and an optimized render pipeline, SciChart provides extremely fast, realtime JavaScript charts capable of drawing millions of data-points in realtime …” [read more]
This is a very early prototype … but we wanted to share with you some exciting news … SciChart is working on a High Performance, Realtime Javascript Chart Component for the Web.
Known as SciChart.js, this component will utilise our extensive 2D & 3D rendering engine built in C++, we currently use across our market-leading WPF, and iOS & Android Charts. Our proprietary rendering engine provides us with the ability to draw primitives in Immediate-Mode rendering at extremely high speed as well as high performance 2D & 3D Charts on multiple platforms. Millions of lines and thousands of primitives on screen at once at not a problem for SciChart. Our rendering engine has been successfully compiled to WebGL and WebAssembly , a new native binary format for the web, enabling native speed by taking advantage of the CPU and GPU. All in a cross-platform, browser-based, javascript compatible package.
Traditional chart components for the web tend to be based on Javascript or Typescript and the HTML5 Canvas, however these are simply too slow to be able to display large amounts of data required for creating big-data applications, or realtime applications that require higher performance in the browser. SciChart however is an excellent choice for applications that require big-data visualization or applications that require real-time charts such as medical applications, or financial trading applications and we are excited about the prospect of WebAssembly for totally changing the web in the future.
Well we are aiming to support our whole host of 3D Charts that we currently support in WPF (Windows), and soon iOS and Android, in the web browser for the first release. We intend the library to be fully compatible with vanilla Javascript applications as well as ASP.NET, Knockout.js, Angular, React and Vue.js.
We’re aiming to support big-data and real-time streaming 2D Charts for Javascript shortly afterwards, by releasing a 2D version of scichart.js for web applications.
One of our hottest feature requests for SciChart WPF was faster performance in some cases. You can see request here on our feedback portal.
So how do we get faster 2D Charts? We need to massively streamline the render pipeline using C++, part of our original vision for cross-platform 2D & 3D charts, then to re-use that in WebAssembly.
Turns out our graphics engine works in WebAssembly for drawing 2D charts as well.
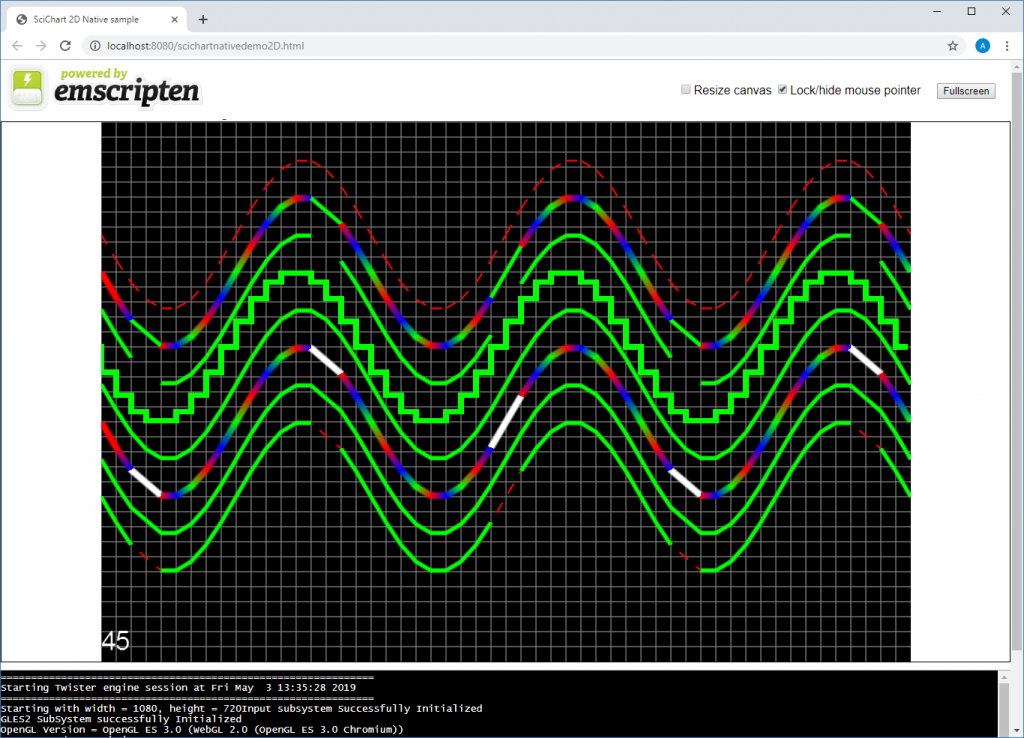
Of course, there’s a lot of work to do here. The above is pure webassembly, no Javascript API, no settings or RenderableSeries or DataSeries or ChartModifiers, no Axis and so on and so forth. However, it proves the concept that our technology can work to create fast, 2D & 3D charts for the web.
The first question we’re going to be asked is ‘When will it be ready!!’ We can’t tell you that just yet … It’s a big job to get our charts ready for the web, but we have already made a start a short while ago. Because we took the steps in the past to port a lot of our drawing code over to C++ for sharing with multiple platforms, its going to be easier to produce a new Fast Javascript Chart Component utilising WebAssembly and WebGL, as we are moving toward a shared code-base model as described in our Vision & Roadmap document.
So we will keep you updated. We hope to have some more results in the coming months, as we continue the compilation and bug fixing of our rendering engine in WebAssembly/WebGL.
Are you interested in real-time high performance 2D & 3D Charts for Javascript applications? To be notified about updates of SciChart.js as we develop for this exciting new platform, sign up below:
SciChart is a High Performance, Realtime Chart component. Capable of drawing many millions of data-points, SciChart is the Best Chart component for WPF (Windows), providing extremely fast, and flexible charts for Big-Data, Scientific, Medical and Financial applications that demand the best performance and user experience.
SciChart is also available for mobile devices, allowing extremely high performance charts on the iOS and Android Platforms. You can find out more about SciChart by visiting our website.
Related Posts
![]()
Queens Award for Innovation
Proud winners of the Queens Award for Innovation, 2019. Awarded on account of our innovative graphics engine which underpins the SciChart library and enables our world-beating charting performance
![]()
National Business Awards
Highly Commended for Lloyds National Business Awards, 2019. Awarded on account of our innovative graphics engine and impressive customer base
![]()
National Technology Awards
Awarded “Healthcare Tech of the Year” at the 2025 National Technology Awards – a top UK recognition for breakthrough innovation in technology.

Reviews
SciChart has received hundreds of verified, 3rd party reviews