SciChart.js v5.1.0 Released!
Just six weeks after the release of SciChart.js v5.0, we have another minor update for you: SciChart.js v5.1.0. In this […]
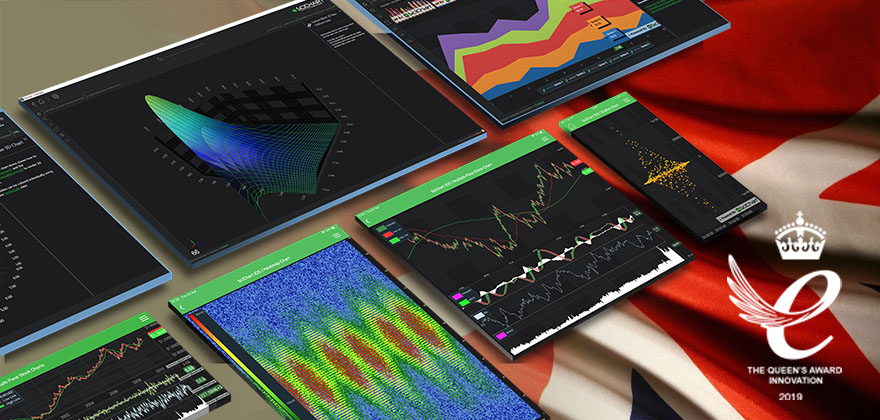
Today we have an exciting announcement to make about SciChart: High Performance Realtime Charts!
After years of researching and developing cutting-edge technologies to bring big-data, realtime charting to the Windows, iOS & Android platforms, SciChart has been awarded the coveted Queens Award for Enterprise, Innovation category.
The Queen’s Awards for Enterprise are for outstanding achievement by UK businesses in the categories of Innovation, International Trade, Sustainable Development or Promoting Opportunity through Social Mobility.
It is the Innovation category which SciChart has been awarded, and we are proud to be one of only 61 companies to win this category in the U.K. in 2019.
In the category of Innovation, a company must demonstrate that it meets the strict criteria, which include:
In the case of SciChart, we were able to demonstrate our novel & innovative technology in two areas: mixing of graphics rasterization technology with the much slower immediate-mode rendering provided by platforms such as WPF to dramatically speed up business and scientific charts, as well as novel data-reduction and lossless resampling algorithms enabling large datasets to be displayed in record time on desktop, mobile devices and embedded systems.
This results in our best-selling software component, which enables you to add extremely fast charts to your scientific, medical, financial and business applications.

These changes have dramatically shifted the market, first in WPF (Windows desktop) charts and now in iOS Charts & Android mobile charts, where prior to SciChart’s existence it was simply not possible to display big-data or real-time charts with large datasets on these platforms. Thanks to SciChart’s innovations in these fields, many impossible software projects have now become possible. Many competitors have imitated some of these innovations and as a result, the market and demand for fast, real-time, big-data charts in business applications on desktop & mobile grown considerably.
SciChart has been able to demonstrate outstanding commercial success, including almost 500% growth over 5 years, year on year growth in revenue and not one year without a profit, with very strong international trade: 90% of orders coming from outside the UK. The criteria for meeting commercial success by the Queens Award examiners are quite strict and needed to be audited and confirmed by chartered accountants.

Our commercial success was compounded by the reputational success of SciChart, which has earned a 98% approval rating from customers, and has over 250 4 and 5-star reviews and testimonials from verified customers, earning us the reputation of the Best WPF Chart control by users and we are quickly gaining a reputation as a market leader, creating the worlds fastest chart & graph controls on iOS & Android platforms.
Furthermore, SciChart’s charting & graphics software has made an important contribution to the wider world enabling previously impossible projects to become possible. Some such projects, which have been made possible with SciChart’s fast, realtime WPF, iOS & Android charts include:
Finally SciChart’s charitable work whereby we aim to donate 10% of profits to various charities, including; child sponsorship of 40 children in the developing world through Compassion UK and donations to rehab & homelessness charity Inside Out in Hull, U.K. have shown that SciChart is a socially-responsible organisation which wishes to make a positive impact in the wider world beyond technology.
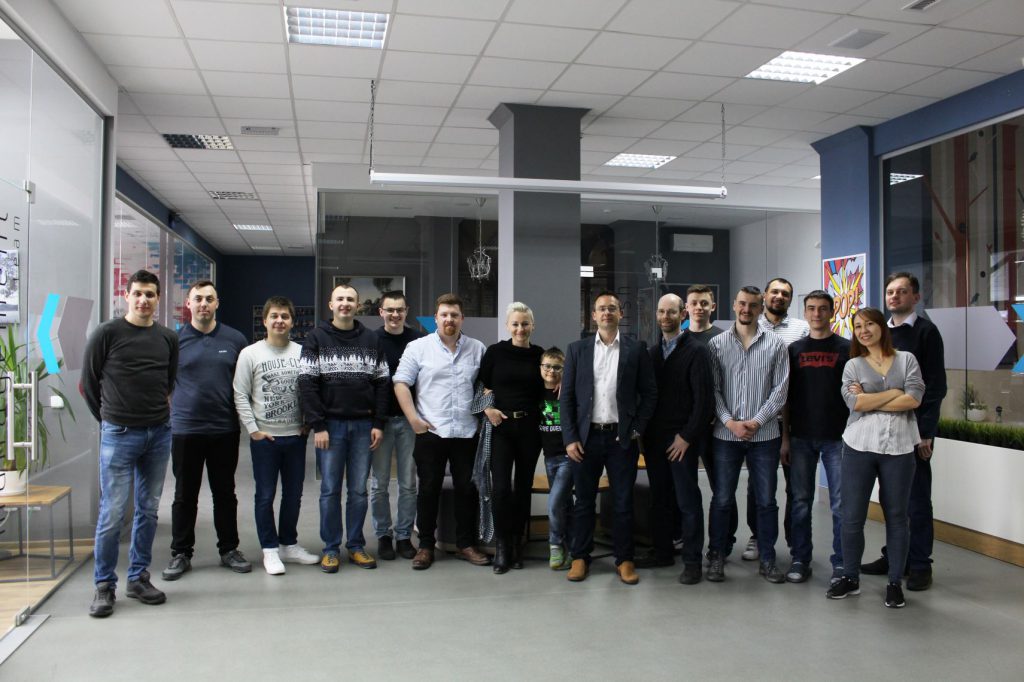
Based in London, UK, SciChart is a privately-owned business with $1.4million USD in turnover and thousands of customers in almost 80 countries. Led by Director and software architect Dr. Andrew Burnett-Thompson, SciChart designs, develops and sells a software component to business and enterprise to draw fast, visually-appealing graphs, graphics and visualizations for the scientific, medical, financial and engineering industries.
SciChart’s game-changing innovation was to combine proprietary data resampling algorithms and technology from the gaming industry for speed & performance of graphics with enterprise software applications, resulting in a software library which was able to draw charts, graphs and other visualizations many orders of magnitude faster than competitors.
SciChart’s fast, real-time charts & graphs enabled customers to bring to market cutting-edge new innovations at a fraction of the cost and time of developing the graphics software themselves. As a result, SciChart has grown organically from a single-person company to an international business with just under 20 full-time staff, with thousands of customers worldwide and all without outside investment or debt, overtaking established competitors with larger resources.
SciChart has secured a position as “Best in class” for charting & graphics software and continues to innovate, driving performance improvements, supporting new platforms & features helping its customers to conquer new sectors and drive market share.
SciChart Ltd
16 Beaufort Court, Admirals Way,
Docklands, London. E14 9XL.
Press contacts or sales enquiries: sales@scichart.com
SciChart provides high performance realtime chart components on the WPF (Windows), iOS, Android and Xamarin platforms. It is our goal to create the best cross-platform WPF, iOS & Android 2D & 3D charts in the world, focusing on performance, developer productivity, ease of use, depth of features and enterprise-grade tech support.
If you have a question about what SciChart can offer you, or if you would like to get a quote, please contact us. Our friendly, helpful support team will be glad to help!
Windows 7,8,10

The World’s Best 2D & 3D WPF Chart with DirectX Hardware Acceleration and legendary tech support!
IOS (IPAD/IPHONE)

The World’s Fastest iOS Chart! designed for engineering, scientific, medical and trading apps.
ANDROID (TABLET/PHONE)

The World’s Fastest Android Chart! designed for embedded systems, scientific, medical & trading apps.
Related Posts
![]()
Queens Award for Innovation
Proud winners of the Queens Award for Innovation, 2019. Awarded on account of our innovative graphics engine which underpins the SciChart library and enables our world-beating charting performance
![]()
National Business Awards
Highly Commended for Lloyds National Business Awards, 2019. Awarded on account of our innovative graphics engine and impressive customer base
![]()
National Technology Awards
Awarded “Healthcare Tech of the Year” at the 2025 National Technology Awards – a top UK recognition for breakthrough innovation in technology.

Reviews
SciChart has received hundreds of verified, 3rd party reviews