DirectX Compatibility in WPF Charts with SciChart
SciChart now features an optional DirectX10 based renderer. This is currently included as an add-on to the SciChart High Performance […]
SciChart WPF v5.1 will be released in the next few days. Here’s a sneak peak what we have added along with many features & bug fixe!
Back in 2012 when SciChart WPF first came into existence, our main goal was to deliver High Performance, Realtime Charts to desktop applications on the Windows Presentation Foundation platform. Over the years our performance goalposts have moved. Originally we wanted to draw 100,000 points in realtime, then a million, then ten million! SciChart WPF v4 was an extremely fast & performant version of SciChart which was able to draw 10 million points (or more) for line series, a million or so for scatter series, and could comfortably draw hundreds or even thousands of series.
However, our users want more! Some of our power-users are using SciChart to draw huge datasets, so as a result, we’ve undertaken work to improve the speed of our WPF Charts in certain key areas, including:
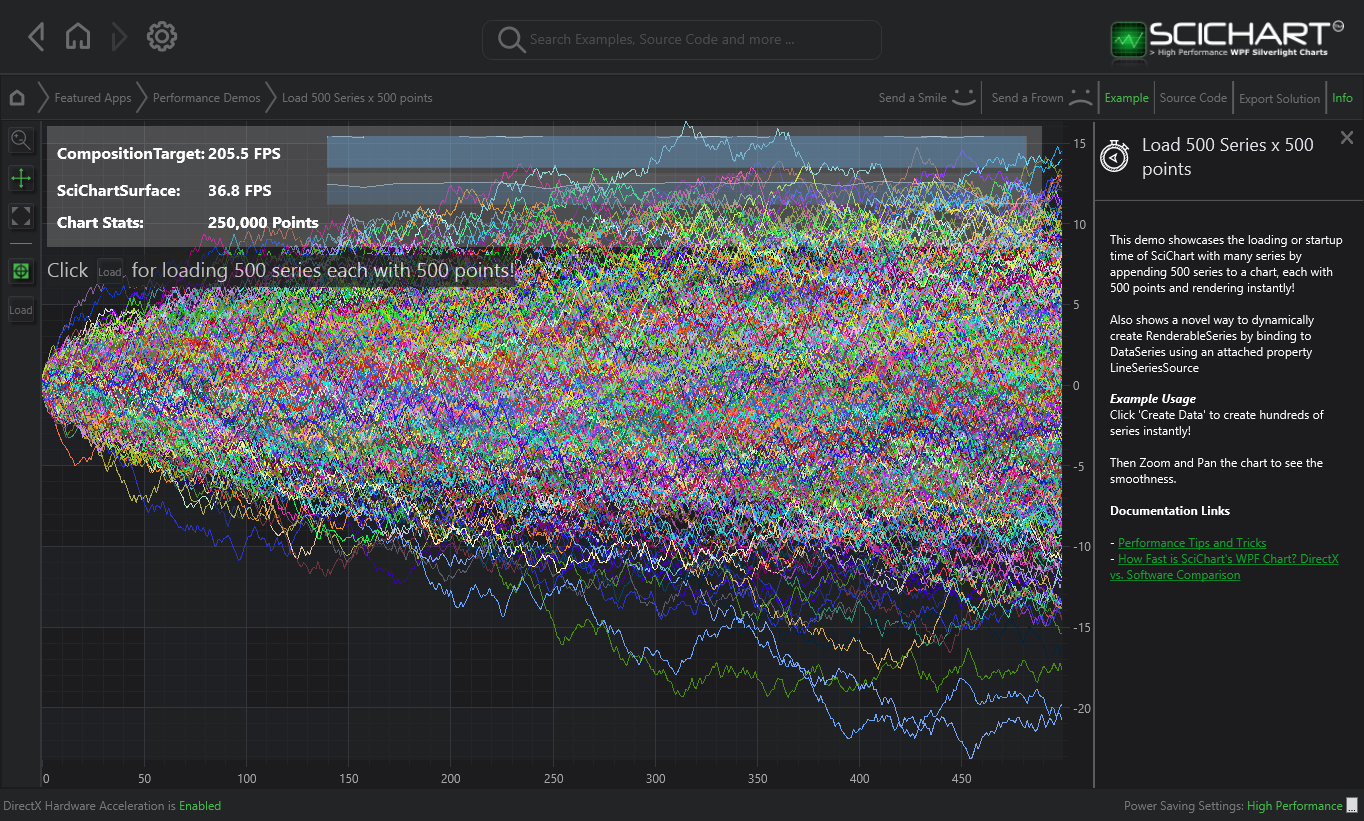 SciChart WPF v4 had a bottleneck where there were many series, each with few points. In this case the lossless resampling algorithm built into SciChart was unable to reduce the data drawn on screen. As a result the bottleneck because raw drawing of points.
In SciChart v5.1 we have added a new experimental drawing mode, which applies to line series only. This mode improves the performance of line series drawing up to 4x faster than previous version(s) of SciChart.
To enable faster drawing of line series, use the following code:
<s:SciChartSurface s3D:DirectXHelper.TryApplyDirectXRenderer="True"
                   s:PerformanceHelper.EnableExtremeDrawingManager="True">
   ...
</s:SciChartSurface>
PerformanceHelper.SetEnableExtremeDrawingManager(sciChartSurface, true);
DirectXHelper.SetTryApplyDirectXRenderer(sciChartSurface, true);
 SciChart WPF v4 had a bottleneck where FIFO (first in first out) DataSeries were used. In this mode, the dataseries had to be unwrapped from a circular buffer before being drawn. This copy step took some time and for larger data-sets (>10Million points) it caused a severe performance bottleneck.
In SciChart v5.1 we have added a new experimental set of resampling algorithms, which performs resampling in-place (does not unwrap). The result is the performance of FIFO Series is up to 4x faster than previous version(s) of SciChart.
To enable faster FIFO resampling, use the following code:
<s:SciChartSurface s3D:DirectXHelper.TryApplyDirectXRenderer="True"
                   s:PerformanceHelper.EnableExtremeResamplers="True">
   ...
</s:SciChartSurface>
PerformanceHelper.SetEnableExtremeResamplers(sciChartSurface, true);
DirectXHelper.SetTryApplyDirectXRenderer(sciChartSurface, true);
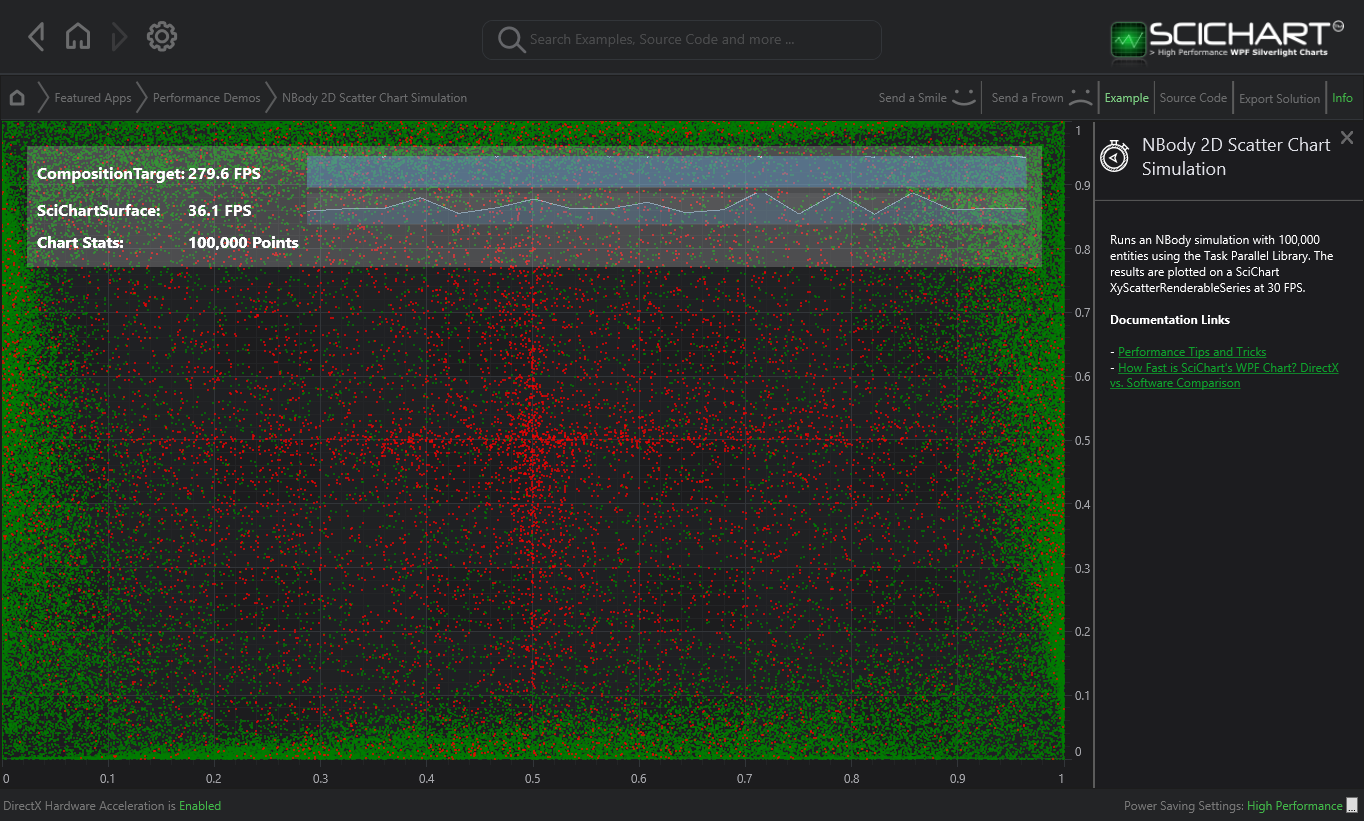 SciChart WPF v5 had a bottleneck where the Scatter Series was used with the PaletteProvider (changing point-color frequently as data updates). This was reported by several users who wanted to visualize a fourth dimension of data.
In SciChart v5.1 we have added a new series type: ExtremeScatterRenderableSeries. This series type adds an optimization which is available for DirectX only. When the optimization is enabled, points are drawn as batches and there is no performance hit when switching color dynamically in the scatter series. The new implementation is over 10x faster than the old scatter series when palette provider is enabled. (For non paletted series, the performance is the same).
To enable faster performance Scatter Series with PaletteProvider, use the following code:
<s:SciChartSurface s3D:DirectXHelper.TryApplyDirectXRenderer="True">
    <s:SciChartSurface.RenderableSeries>
        <s:ExtremeScatterRenderableSeries x:Name="scatterSeries">
            <s:ExtremeScatterRenderableSeries.PointMarker>
                <s:EllipsePointMarker Width="5" Height="5"/>
            </s:ExtremeScatterRenderableSeries.PointMarker>
        </s:ExtremeScatterRenderableSeries>
    </s:SciChartSurface.RenderableSeries>
   ...
</s:SciChartSurface>
DirectXHelper.SetTryApplyDirectXRenderer(sciChartSurface, true);
scatterSeries.PaletteProvider = new TestPaletteProvider(new Color[] { Colors.Red, Colors.Green, Colors.Blue ... } );E

// where ExtremePaletteProvider defined as
public class TestPaletteProvider : IExtremePointMarkerPaletteProvider
{
    private readonly List<Color> _dataPointColors;
    private readonly Values<Color> _colors = new Values<Color>();

    public TestPaletteProvider(List<Color> dataPointColors)
    {
        _dataPointColors = dataPointColors;
    }

    public Values<Color> Colors { get { return _colors; } }

    public void OnBeginSeriesDraw(IRenderableSeries rSeries)
    {
        var indexes = rSeries.CurrentRenderPassData.PointSeries.Indexes;
        var count = indexes.Count;
        _colors.Count = count;

        // copy required colors from list using data point indices
        for (int i = 0; i < count; i++)
        {
            var dataPointIndex = indexes[i];
            _colors[i] = _dataPointColors[dataPointIndex];
        }
    }
}
Additional functionality has been added in SciChart v5.1. With a re-write of our resampling algorithms taking advantage of templating in C++ we now have the fastest, most accurate resampling algorithms ever, taking care of many edge cases that were reported such as handling datasets which included NaN (null points) and uneven datasets.
These improvements are enabled by setting the following code in your application:
<s:SciChartSurface s:PerformanceHelper.EnableExtremeResamplers="True">
   ...
</s:SciChartSurface>
PerformanceHelper.SetEnableExtremeResamplers(sciChartSurface, true);
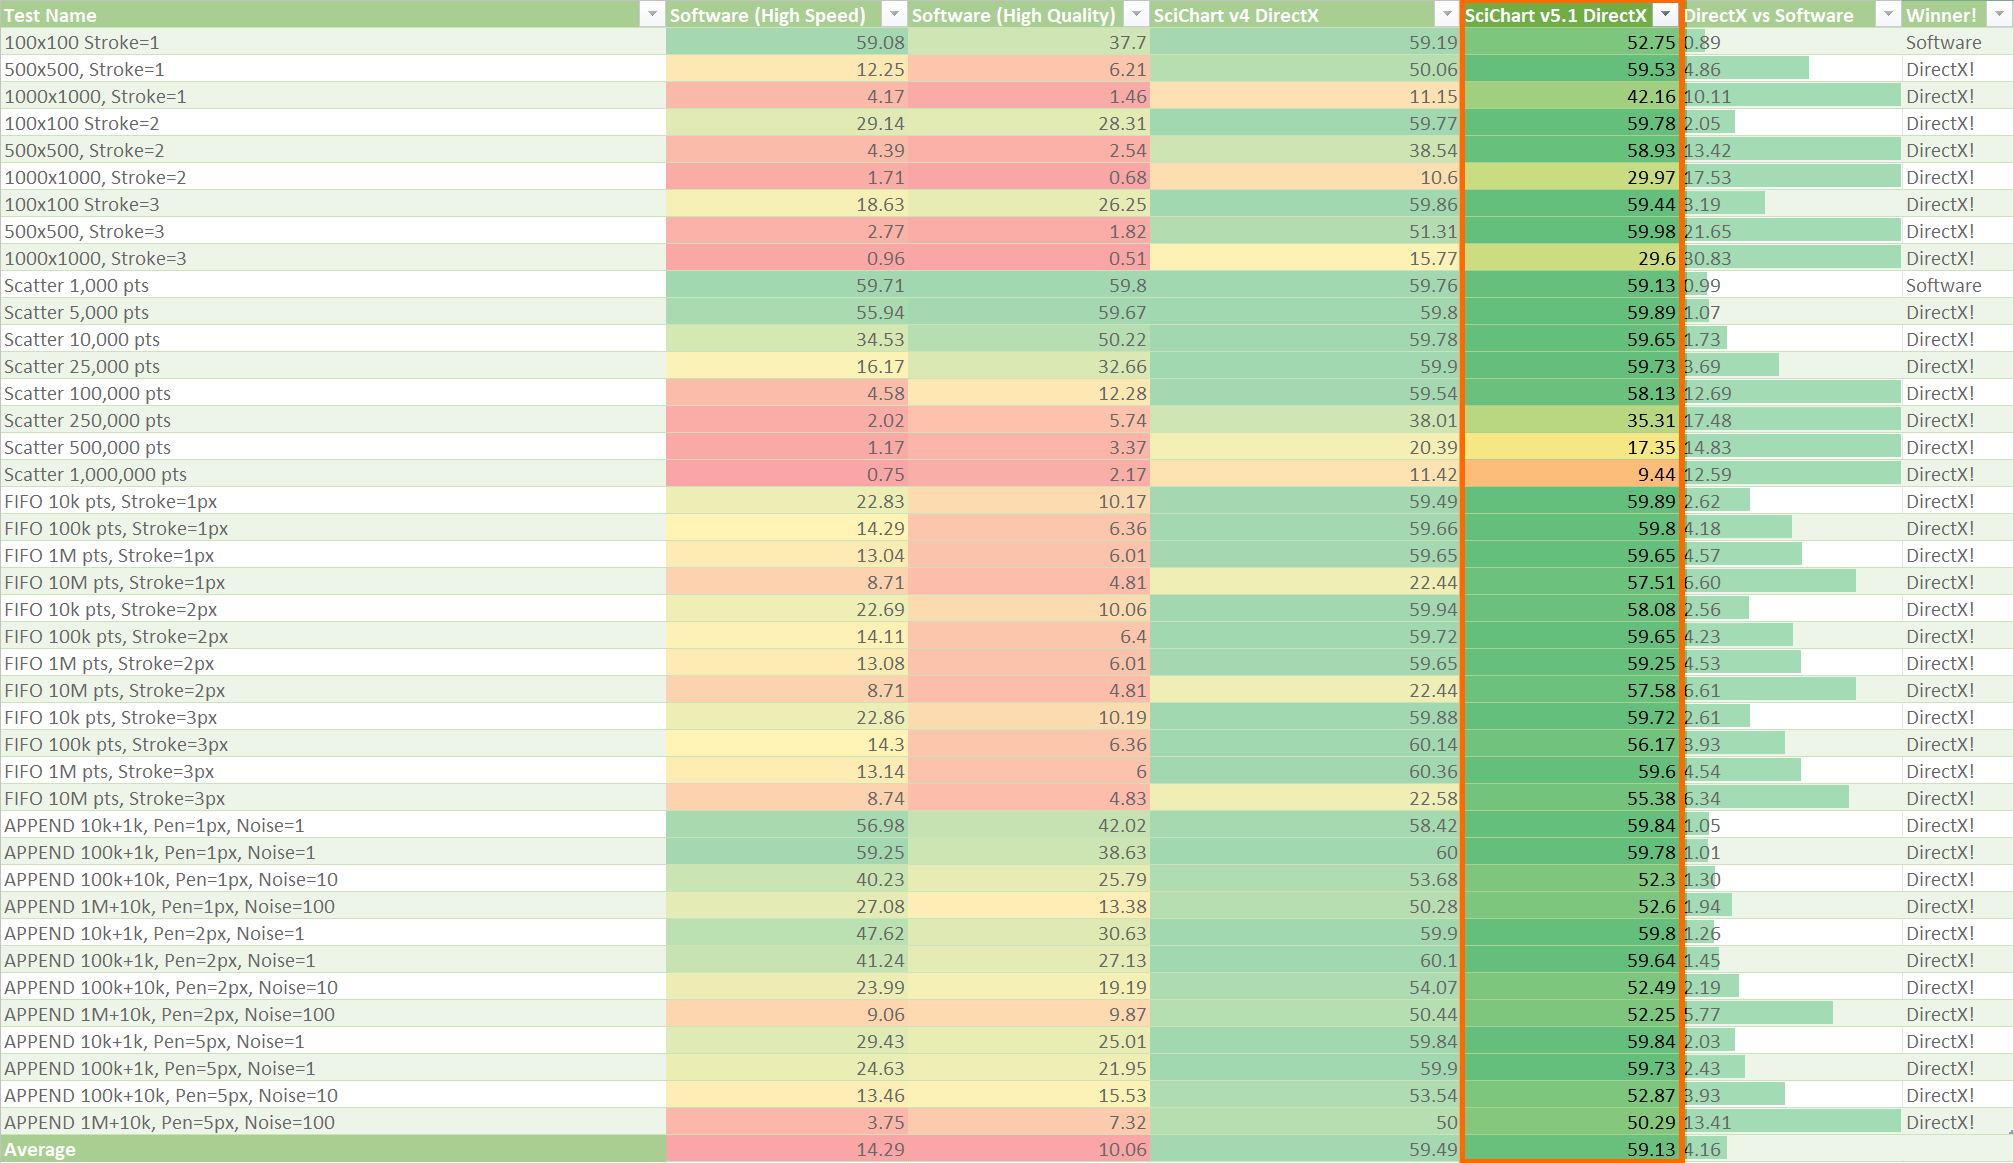
You can see our updated performance benchmark over here at How Fast is SciChart’s WPF Chart! Over the years we have worked hard to maintain and improve performance, so that SciChart can be used in Big-Data, scientific and financial applications around the world.
Best regards,
Andrew
Related Posts
![]()
Queens Award for Innovation
Proud winners of the Queens Award for Innovation, 2019. Awarded on account of our innovative graphics engine which underpins the SciChart library and enables our world-beating charting performance
![]()
National Business Awards
Highly Commended for Lloyds National Business Awards, 2019. Awarded on account of our innovative graphics engine and impressive customer base
![]()
National Technology Awards
Awarded “Healthcare Tech of the Year” at the 2025 National Technology Awards – a top UK recognition for breakthrough innovation in technology.

Reviews
SciChart has received hundreds of verified, 3rd party reviews