
The HorizontalLineAnnotation draws a horizontal line at Y1 where coordinates are data-values. The HorizontalLineAnnotation supports Stroke, StrokeThickness properties and shows an optional Axis label.
The HorizontalLineAnnotation may be stretched (horizontally) across the viewport or drawn to a specific X-value
Declaring a HorizontalLineAnnotation in XAML
| Declaring a HorizontalLineAnnotation |
Copy Code |
|---|---|
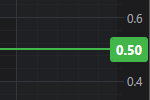
<!-- Where xmlns:s="http://schemas.abtsoftware.co.uk/scichart" --> <s:SciChartSurface> <s:SciChartSurface.Annotations> <!-- Declares a HorizontalLineAnnotation at Y1=5 --> <!-- The annotation will move with the chart as you zoom and pan --> <s:HorizontalLineAnnotation Stroke="Orange" StrokeThickness="1" Y1="5"/> </s:SciChartSurface.Annotations> </s:SciChartSurface> | |
Declaring a HorizontalLineAnnotation in Code
| Declaring a HorizontalLineAnnotation |
Copy Code |
|---|---|
var sciChartSurface = new SciChartSurface(); sciChartSurface.Annotations.Add(new HorizontalLineAnnotation() { Stroke = new SolidColorBrush(Colors.Orange), StrokeThickness = 1, Y1 = 5, IsEditable = true, }); | |
Showing an Annotation Label on the Axis
By default, the HorizontalLineAnnotation does not show the a label. You can show a label by adding an AnnotationLabel to the HorizontalLineAnnotation.AnnotationLabels collection.
| Showing an Annotation Label on the Axis |
Copy Code |
|---|---|
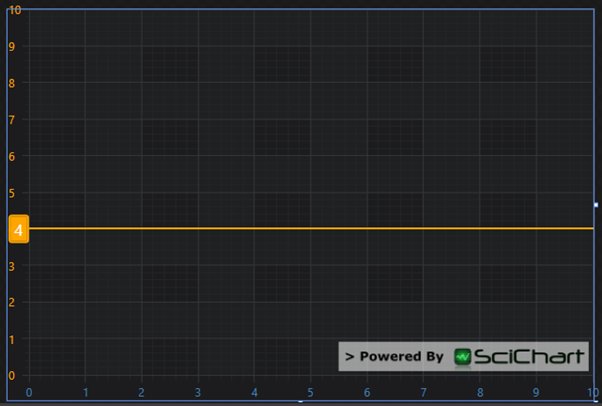
<s:SciChartSurface > <s:SciChartSurface.XAxis> <s:NumericAxis AxisAlignment="Bottom" AxisTitle="Left XAxis" TickTextBrush="SteelBlue"/> </s:SciChartSurface.XAxis> <s:SciChartSurface.YAxis> <s:NumericAxis AxisAlignment="Left" AxisTitle="Top YAxis" TickTextBrush="Orange"/> </s:SciChartSurface.YAxis> <s:SciChartSurface.Annotations> <s:HorizontalLineAnnotation Y1="4" Stroke="Orange" StrokeThickness="2"> <s:HorizontalLineAnnotation.AnnotationLabels> <s:AnnotationLabel LabelPlacement="Axis" FontSize="16" Foreground="White"/> </s:HorizontalLineAnnotation.AnnotationLabels> </s:HorizontalLineAnnotation> </s:SciChartSurface.Annotations> </s:SciChartSurface> | |
Which Results in
Changing the Label Position, Foreground and Rotation Angle
The Label position can be changed by setting the AnnotationLabel.LabelPlacement property. Valid settings are Axis, Bottom, Top, BottomLeft, BottomRight, Left, Right.
AnnotationLabel.RotationAngle is valid when the AnnotationLabel.LabelPlacement is not on the Axis. This allows you to rotate the label 90 degrees when placed next to a line.
The AnnotationLabel Foreground by default binds to the ThemeKey TickTextBrush when the label is on the axis, or the VerticalLineAnnotation.Stroke when the label is not on the axis. You can override this by setting AnnotationLabel.Foreground to any color.
More than one Label on a HorizontalLineAnnotation
You can have more than one label bound to a HorizontalLineAnnotation by adding more than one AnnotationLabel to the VerticalLineAnnotation.AnnotationLabels collection.
| More than one Label on a HorizontalLineAnnotation |
Copy Code |
|---|---|
<s:SciChartSurface.Annotations> <s:HorizontalLineAnnotation Y1="4" Stroke="Orange" StrokeThickness="2"> <s:HorizontalLineAnnotation.AnnotationLabels> <s:AnnotationLabel LabelPlacement="TopRight" FontSize="12" Foreground="Orange"/> <s:AnnotationLabel LabelPlacement="Axis" FontSize="16" Foreground="White"/> </s:HorizontalLineAnnotation.AnnotationLabels> </s:HorizontalLineAnnotation> </s:SciChartSurface.Annotations> | |
Changing the Label TextFormatting
By default, the label text is formatted by the axis. See the AxisBase.CursorTextFormatting property described in Section 4.4.1.
You can also override the textformatting by using a .NET Formatting string by setting the HorizontalLineAnnotation.LabelTextFormatting property.
| Changing the Label TextFormatting |
Copy Code |
|---|---|
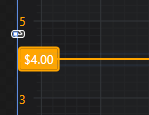
<s:SciChartSurface.Annotations> <s:HorizontalLineAnnotation Y1="4" Stroke="Orange" StrokeThickness="2" LabelTextFormatting="$0.00"> <s:HorizontalLineAnnotation.AnnotationLabels> <s:AnnotationLabel LabelPlacement="Axis" Foreground="White" /> </s:HorizontalLineAnnotation.AnnotationLabels> </s:HorizontalLineAnnotation> </s:SciChartSurface.Annotations> | |
HorizontalAlignment Stretch and Partially Drawn Lines
HorizontalLineAnnotations do not need to stretch across the whole viewport, but can be drawn partially (e.g. to a X-value).
The following code:
| HorizontalAlignment Stretch and Partially Drawn Lines |
Copy Code |
|---|---|
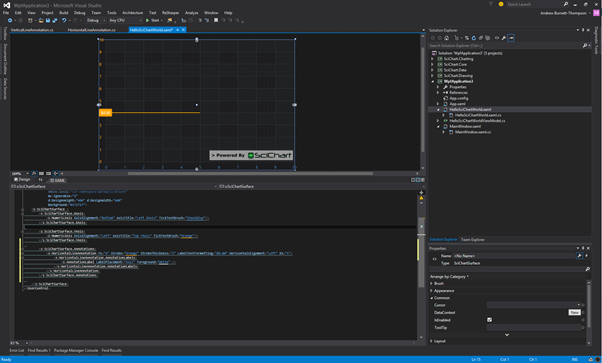
<s:SciChartSurface > <s:SciChartSurface.XAxis> <s:NumericAxis AxisAlignment="Bottom" AxisTitle="Left XAxis" TickTextBrush="SteelBlue"/> </s:SciChartSurface.XAxis> <s:SciChartSurface.YAxis> <s:NumericAxis AxisAlignment="Left" AxisTitle="Top YAxis" TickTextBrush="Orange"/> </s:SciChartSurface.YAxis> <s:SciChartSurface.Annotations> <s:HorizontalLineAnnotation Y1="4" Stroke="Orange" StrokeThickness="2" LabelTextFormatting="$0.00" HorizontalAlignment="Left" X1="5"> <s:HorizontalLineAnnotation.AnnotationLabels> <s:AnnotationLabel LabelPlacement="Axis" Foreground="White" /> </s:HorizontalLineAnnotation.AnnotationLabels> </s:HorizontalLineAnnotation> </s:SciChartSurface.Annotations> </s:SciChartSurface> | |
Results in
Templating the HorizontalLineAnnotation
The Default Style and ControlTemplate for the HorizontalLineAnnotation is defined below.
| Templating the HorizontalLineAnnotation |
Copy Code |
|---|---|
<Style BasedOn="{StaticResource AnnotationBaseStyle}" TargetType="a:HorizontalLineAnnotation"> <Setter Property="Stroke" Value="{me:ThemeBinding RubberBandStrokeBrush}" /> <Setter Property="StrokeThickness" Value="2.0" /> <Setter Property="LabelTextFormatting" Value="{Binding DefaultTextFormatting, Mode=OneWay, RelativeSource={RelativeSource Self}}" /> <Setter Property="LabelValue" Value="{Binding DefaultLabelValue, Converter={StaticResource IComparableToObject}, Mode=OneWay, RelativeSource={RelativeSource Self}}" /> <Setter Property="Template"> <Setter.Value> <ControlTemplate TargetType="a:HorizontalLineAnnotation"> <Grid x:Name="PART_LineAnnotationRoot" ShowGridLines="False"> <Grid.RowDefinitions> <RowDefinition Height="Auto" /> <RowDefinition Height="*" /> <RowDefinition Height="Auto" /> </Grid.RowDefinitions> <Grid.ColumnDefinitions> <ColumnDefinition Width="Auto" /> <ColumnDefinition Width="*" /> <ColumnDefinition Width="Auto" /> </Grid.ColumnDefinitions> <Line x:Name="PART_GhostLine" Grid.Row="1" Grid.Column="1" VerticalAlignment="Center" Stretch="Fill" Stroke="Transparent" StrokeThickness="{s:Static Member=visuals:ManipulationMargins.AnnotationLineWidth}" X1="0" X2="1" Y1="0" Y2="0" /> <Line x:Name="PART_Line" Grid.Row="1" Grid.Column="1" VerticalAlignment="Center" Stretch="Fill" Stroke="{TemplateBinding Stroke}" StrokeDashArray="{TemplateBinding StrokeDashArray}" StrokeEndLineCap="Square" StrokeStartLineCap="Square" StrokeThickness="{TemplateBinding StrokeThickness}" X1="0" X2="1" Y1="0" Y2="0" /> </Grid> </ControlTemplate> </Setter.Value> </Setter> </Style> | |
Where the styles and control template for AnnotationLabel and AnnotationAxisLabel are defined in Templating the VerticalLineAnnotation