Are you new to SciChart? Check out our most popular pages to get started below:
The SciChartSurface Type
The root 2D chart control is called the SciChartSurface. This is the WPF Control you will be adding to your applications wherever you need a chart. You can add more than one SciChartSurface, you can configure them independently, and you can link them together.
First up, let’s start by declaring one:
Declaring a SciChartSurface Instance
After Referencing the SciChart DLLs from NuGet (package=SciChart), from local DLL files (referencing DLLs SciChart.Charting, SciChart.Drawing, SciChart.Data, SciChart.Core) or the SciChart Source from Github, a SciChartSurface instance can be declared as follows:
XAML
| Declaring a SciChartSurface Instance |
Copy Code |
|---|---|
<!-- Create the chart surface --> <!-- where xmlns:s="http://schemas.abtsoftware.co.uk/scichart" --> <s:SciChartSurface> <!-- Define RenderableSeries --> <s:SciChartSurface.RenderableSeries> <s:FastLineRenderableSeries x:Name="LineSeries0" Stroke="#FF4083B7"/> </s:SciChartSurface.RenderableSeries> <!-- Create an X Axis --> <s:SciChartSurface.XAxis> <s:NumericAxis AxisTitle="Number of Samples (per Series)"/> </s:SciChartSurface.XAxis> <!-- Create a Y Axis --> <s:SciChartSurface.YAxis> <s:NumericAxis AxisTitle="Value"/> </s:SciChartSurface.YAxis> <!-- Specify interactivity modifiers --> <s:SciChartSurface.ChartModifier> <s:ModifierGroup> <s:RubberBandXyZoomModifier /> <s:ZoomExtentsModifier /> </s:ModifierGroup> </s:SciChartSurface.ChartModifier> <!-- Add annotations hints to the user --> <s:SciChartSurface.Annotations> <s:TextAnnotation Text="Hello world!" X1="5.0" Y1="0.2"/> </s:SciChartSurface.Annotations> </s:SciChartSurface> | |
Code
Alternative C# code to declare a SciChartSurface is below:
| Declaring a SciChartSurface Instance |
Copy Code |
|---|---|
// Create the chart surface var sciChartSurface = new SciChartSurface(); // Create a line series var lineSeries0 = new FastLineRenderableSeries() { Stroke = Color.FromArgb(0xFF, 0x40, 0x83, 0xB7)}; sciChartSurface.RenderableSeries.Add(lineSeries0); // Create the X and Y Axis var xAxis = new NumericAxis() { AxisTitle = "Number of Samples (per series)"}; var yAxis = new NumericAxis() { AxisTitle = "Value"}; sciChartSurface.XAxis = xAxis; sciChartSurface.YAxis = yAxis; // Specify Interactivity Modifiers sciChartSurface.ChartModifier = new ModifierGroup(new RubberBandXyZoomModifier(), new ZoomExtentsModifier()); // Add annotation hints to the user var textAnnotation = new TextAnnotation() { Text = "Hello World!", X1=5.0, Y1=0.2 }; sciChartSurface.Annotations.Add(textAnnotation); | |
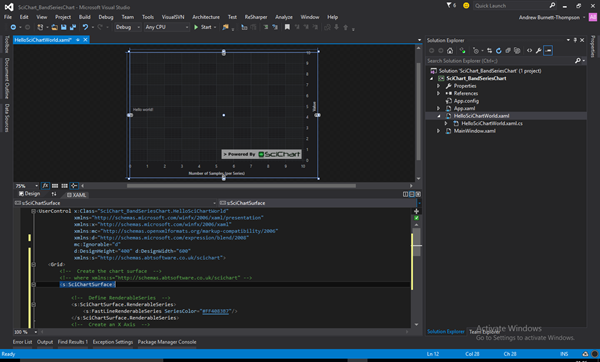
The above code declares a SciChartSurface, adds a (numeric) X and Y Axis, adds a single text annotation and two zoom behaviours. If you declared it in XAML, you should be able to see it in the WPF Designer.
Congratulations, you have just created your first SciChartSurface!