
In our series of tutorials, so far all the charts have had one XAxis and one YAxis.
SciChart supports unlimited, multiple X, and Y Axis on the left, right, bottom and top of the chart. You can change Axis alignment, rotate charts, and mix axis (have both XAxis/YAxis on the left). The possibilities are literally endless!
In this tutorial, we are going to add a second YAxis to the chart. We are going to show how to register annotations and line series on the second axis. We are also going to show how to ensure Axis drag behaviors work on both axis.
Revision
If you haven't already you will need to review the following tutorials, as we're working straight from these:
- Tutorial 04 - Adding Zooming, Panning Behavior
- Tutorial 06 - Adding Realtime Updates
- Tutorial 07 - Adding Annotations
Or, if you're in a hurry, take the code from the end of 'Adding Annotations' and let's get started.
Adding a Second YAxis
The API to add a second YAxis is as follows:
| Before - a Single YAxis |
Copy Code |
|---|---|
<s:SciChartSurface.YAxis>
    <s:NumericAxis AxisTitle="Value" GrowBy="0.1,0.1" VisibleRange="-1.1, 1.1"/>
</s:SciChartSurface.YAxis> | |
| After - Multiple YAxis |
Copy Code |
|---|---|
<s:SciChartSurface.YAxes>
    <s:NumericAxis AxisTitle="Value" GrowBy="0.1,0.1" VisibleRange="-1.1, 1.1"/>
    <s:NumericAxis Id="Axis2"
                   AxisTitle="Secondary" GrowBy="0.1,0.1"
                   VisibleRange="-2.0, 2.0"
                   AxisAlignment="Left"/>
</s:SciChartSurface.YAxes> | |
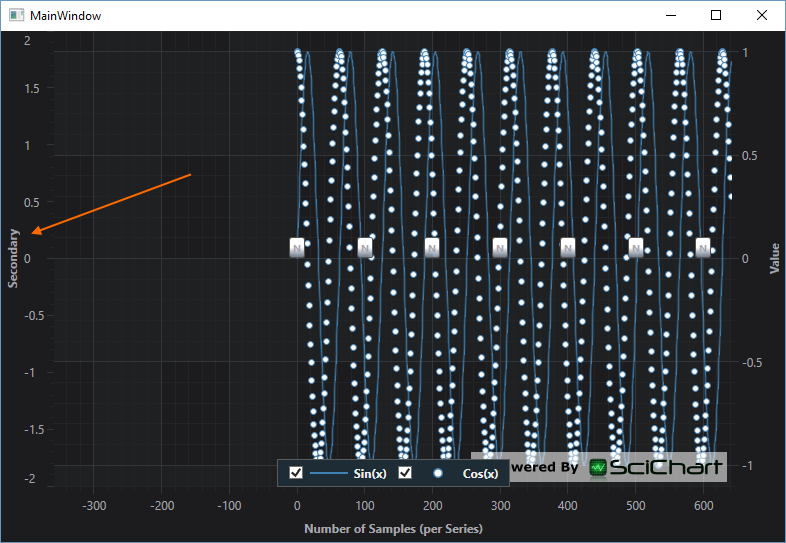
If you run the application now, you should see a YAxis on the left:
Registering RenderableSeries on the second YAxis
We want to now reigster one of the series on the left YAxis. To do this, we set RenderableSeries.YAxisId = Axis.Id.
By default all axis have a default axis ID. In single axis systems there is no need to set an AxisId in scichart. As soon as you have a secondary axis, you need to start setting Axis Ids.
Change just the BaseRenderableSeries.YAxisId on the scatter series in XAML and restart the application:
| Example Title |
Copy Code |
|---|---|
<!-- Change XyScatterRenderableSeries.YAxisid --> <s:XyScatterRenderableSeries x:Name="ScatterSeries" YAxisId="Axis2"> ... <!-- to match the second YAxis.Id --> <s:SciChartSurface.YAxes> <s:NumericAxis AxisTitle="Value" GrowBy="0.1,0.1" VisibleRange="-1.1, 1.1"/> <s:NumericAxis Id="Axis2" AxisTitle="Secondary" GrowBy="0.1,0.1" VisibleRange="-2.0, 2.0" AxisAlignment="Left"/> </s:SciChartSurface.YAxes> | |
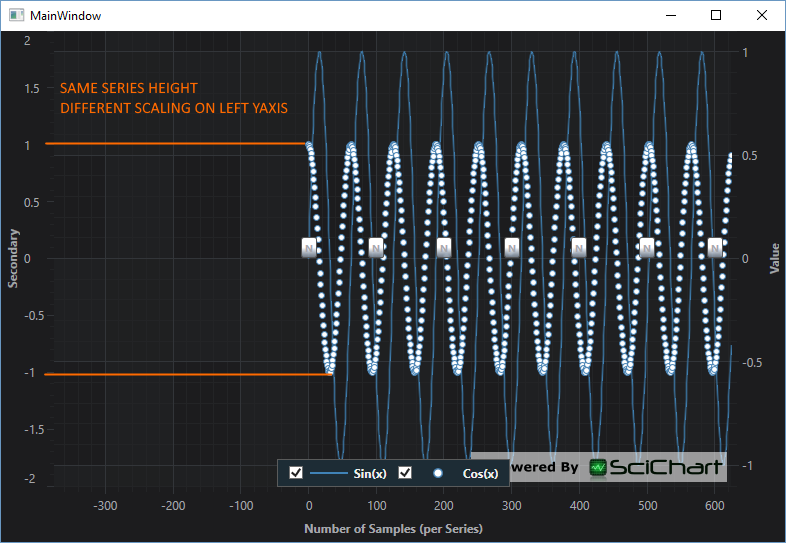
Run the application and you will now notice that the Scatter series has been scaled to half the size. This is because the Secondary YAxis has a VisibleRange of -2, +2 but the series data still has values in the range -1, +1.
Registering Annotations on the Secondary YAxis
Annotations also need to be registered on a YAxis and XAxis. By default the AnnotationBase.XAxisId and AnnotationBase.YAxisId matches the AxisBase.DefaultAxisId.
As soon as you change an Axis.Id you need to consider whether you need to update the XAxisId or YAxisId properties on RenderableSeries, ChartModifiers or Annotations.
Change the code where you add Annotaitons to the chart as follows:
| Adding Annotations with YAxisId |
Copy Code |
|---|---|
| sciChartSurface.Annotations.Add(new InfoAnnotation() { X1 = i, Y1 = 0.0, YAxisId = i % 200 == 0 ? AxisBase.DefaultAxisId : "Axis2" }); | |
We're adding an annotation every 100 datapoints. Every alternate annotation we now change the YAxisId between AxisBase.DefaultAxisId or "Axis2" - the Id of the secondary YAxis.
Now run the application:
If you drag the left YAxis up and down, vs. drag the right YAxis up and down, you can see now which series and annotations are registered on which YAxis.
Further Reading
- Documentation: Adding an Axis to a SciChartSurface
- Documentation: AxisAlignment
- Documentation: Rotating a Chart Vertically
- Documentation: Placing Axis Centrally in the Chart
- Examples: Multiple YAxis Example
- Examples: Multiple XAxis Example